Sound propagation is quite predictable, FEM and BEM have been around for quite some time but have not always been as easily accessible.It is very possible that diffraction simulation has improved significantly since 2017.
A sphere is a more specialised case where the 2D simulation is not as relevant.
The theoretical models of edge diffraction that most non 3D simulators are based on have been set for some time, making them 3D is the improvement which has been available for a long time already.
PHD Thesis with good background
http://citeseerx.ist.psu.edu/viewdoc/download?doi=10.1.1.217.9703&rep=rep1&type=pdf
Papers for the mathematically minded (not me)
http://user.faktiskt.io/svante/JASA106_2331_Svensson.pdf
https://zenodo.org/record/42431/files/1569424561.pdf
Have we even established a common definition for "baffle step frequency"? I get the feeling that just knowing the (your) definition will provide an inherent answer.What is the baffle step frequency of that simulation?
This is the John L. Murphy article that was referred by OP
https://trueaudio.com/st_diff1.htm
I discusses only approximation of axial response of different "cabinet", very very much simplified. It is just one page in series of loudspeaker design issues presented at https://trueaudio.com/st_index.htm
Baffle step (or loss) is just one of the diffraction/interference issues in loudspeaker design. I guess this is why we others have difficulties in understanding the "point" of the OP's question.
For more than 10 years we amateurs have been blessed with inexpensive measurement micropones, soundcards and even free software. Most sw contain modules for simulation, but the modern way to "design" a loudspeaker is to make a test box, take measurements of it (each of it's drivers without eq or xo) up to 180 deg both horizontally and vertically, and use these acoustic measurements as basis for simulation/design. For passive systems we need also T/S parameters and impedance plot throughout the spectrum. Then we are also able to verify the final outcome by measuring the whole system's radiation in 3D. Not to forget impedance, distortion and phase!
VituixCAD 2 is obviously the best freeware sw for speaker design. Lots of helpful background info, even videos available!
List of features of VCAD https://kimmosaunisto.net/Software/Software.html
Linkwitz was a top notch audio engineer. In his presentation at Burning Amp 2017 (see post #13 in this thread), at some point he says that the software at that time for simulating diffraction wasn't worth it. Because he was an excellent engineer, I would take his word on that, but it's possible that he was wrong.Sound propagation is quite predictable, FEM and BEM have been around for quite some time but have not always been as easily accessible.
A sphere is a more specialised case where the 2D simulation is not as relevant.
The theoretical models of edge diffraction that most non 3D simulators are based on have been set for some time, making them 3D is the improvement which has been available for a long time already.
PHD Thesis with good background
http://citeseerx.ist.psu.edu/viewdoc/download?doi=10.1.1.217.9703&rep=rep1&type=pdf
Papers for the mathematically minded (not me)
http://user.faktiskt.io/svante/JASA106_2331_Svensson.pdf
https://zenodo.org/record/42431/files/1569424561.pdf
Possibly John Murphy was the first to conceive of and define the baffle step frequency (the middle of the step of radiating first in half-space and then full-space). In his discussion of the formula for finding the step frequency, he doesn't attribute it to anybody else. In my post #16 in this thread, I would say that I am providing the inherent answer, that is, until someone demonstrates that I've made an error.Have we even established a common definition for "baffle step frequency"? I get the feeling that just knowing the (your) definition will provide an inherent answer.
Let me get this straight. YOU'RE the one who is now providing the inherent answer on what baffle-step frequency is??? 🙂Possibly John Murphy was the first to conceive of and define the baffle step frequency (the middle of the step of radiating first in half-space and then full-space). In his discussion of the formula for finding the step frequency, he doesn't attribute it to anybody else. In my post #16 in this thread, I would say that I am providing the inherent answer, that is, until someone demonstrates that I've made an error.
Dave.
Indeed he was one of the best. It is unlikely that he was "wrong", and now it is not possible to know exactly what he meant or was referring to. Given that it was made at a DIY event I would suspect he was referring to software such as Jeff Bagby's baffle diffraction spreadsheet. No doubt that was of limited value to him as he was able to think in mathematical terms. For the average person basic baffle diffraction simulation is an important tool. The only downside is that it does not consider all three dimensions and therefore does not give a complete answer. A full polar measurement or 3D simulation as I and DonVK provided above shows the total radiation and directivity.Linkwitz was a top notch audio engineer. In his presentation at Burning Amp 2017 (see post #13 in this thread), at some point he says that the software at that time for simulating diffraction wasn't worth it. Because he was an excellent engineer, I would take his word on that, but it's possible that he was wrong.
Actually, Linkwitz was referring to the program "EDGE" which he played with for awhile and found un-useful for the dipole baffle-diffraction efforts he was interested in. Lack of asymmetrical analysis was his primary issue, because it had no way to model the low-pass behavior and rear-radiation effects that were of primary interest to him.
Dave.
Dave.
Being handicapped in maths, as well as dumb and lazy, I have found interactive simulation such as the Edge helpful. Helpful to get the idea of what is happening and how change of different parameters like baffle shape, driver location and diameter or off-axis angle make variations.
I get no value from knowing exact f3, but what happens beyond that is interesting! In modern world, 3D measurements tell exactly what is happening, but making tests of eg. driver location means lots of labor. ...been there, done that!
The value of f3 of baffle step is just a starting point for baffle step compensation. Very crude, because BS peak and null shape remains unknown. And off-axis behavior, where box depth plays a role. With dipoles, a cone driver means much more surprises!
Last edited:
No, what I am saying is that possibly my post #16 in this thread is the answer to my own question. The question was, what is the sound pressure level directly behind the speaker relative to that directly in front of the speaker at the baffle step frequency? If the speaker system is closed- box by means of a sphere, then I think that the solution that I arrive at might be correct. But as I said, my understanding of acoustics is limited and I'm not the best at math either. Some checking that I have done seems to indicate that it holds water.Let me get this straight. YOU'RE the one who is now providing the inherent answer on what baffle-step frequency is??? 🙂
Dave.
How do explain the effect when the speaker is EQ'd flat on axis 20-20Khz and there is still a changing SPL at the rear of the speaker ?
There is no conservation of SPL around the speaker. The radiation pattern is changing as shown in post#31 where the on axis is always 0dB and the relative attenuation (dBr) and radiation shape can be read off the polar coordinate plots.
There is no conservation of SPL around the speaker. The radiation pattern is changing as shown in post#31 where the on axis is always 0dB and the relative attenuation (dBr) and radiation shape can be read off the polar coordinate plots.
The question was, what is the sound pressure level directly behind the speaker relative to that directly in front of the speaker at the baffle step frequency?
OK, so back to the question. We can look at some measurements I recently did.
My cabinet is 10" wide, so according to the equation in post #34, the baffle step frequency is 456 Hz.
Here is the quasi anechoic data at 0, 90 and 180 degrees. These were taken with an Audix TM1 mic with ARTA, using a rotating turntable.
At 450 Hz it looks like about 6 dB difference between 0 and 180, maybe a bit less?
I do not claim that this result can be universally applied to other systems, but it is one data point.
Attachments
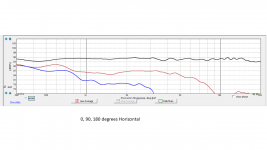
Your result is about the same as the testing of a cube each dimension of which is equal to 10.5 inches. For the cube, the baffle step frequency equals 430 Hz about equal to 390 Hz. The testing of the cube is on p.9 of the PDF file linked to at post #13, this thread.OK, so back to the question. We can look at some measurements I recently did.
My cabinet is 10" wide, so according to the equation in post #34, the baffle step frequency is 456 Hz.
Here is the quasi anechoic data at 0, 90 and 180 degrees. These were taken with an Audix TM1 mic with ARTA, using a rotating turntable.
At 450 Hz it looks like about 6 dB difference between 0 and 180, maybe a bit less?
I do not claim that this result can be universally applied to other systems, but it is one data point.
The source of pressure on the air volume is the loudspeaker driver. Assuming that this pressure is constant irrespective of the radiating frequency of the driver, pressurization of the air is a function of the volume of air that the driver acts on. The driver changing from radiating into full space to half-space results in a doubling of air pressure due to a reduction of the volume of air that the driver acts on by one-half. A doubling of air pressure is an increase of sound pressure level of 6 dB.How do explain the effect when the speaker is EQ'd flat on axis 20-20Khz and there is still a changing SPL at the rear of the speaker ?
There is no conservation of SPL around the speaker. The radiation pattern is changing as shown in post#31 where the on axis is always 0dB and the relative attenuation (dBr) and radiation shape can be read off the polar coordinate plots.
The above perhaps doesn't agree with your data as the above is under ideal conditions, i.e., a loudspeaker driver mounted on a spherical closed box. But in general at the extremes of frequency above and below the baffle step frequency there is no denying a shift from radiation to the front only and more or less uniform radiation all around the driver.
Last edited:
The simulation of your post #31 is only showing SPL at angles other than 0 degrees relative to 0 dB at the angle 0 degrees. That is, throughout the simulation at any frequency, SPL at 0 degrees equals 0 dB. At 102 Hz, SPL at 180 degrees equals almost 0 dB or the same as SPL at 0 degrees. At 2 kHz, SPL at 180 degrees equals less than -9 dB relative to 0 dB at the angle 0 degrees.How do explain the effect when the speaker is EQ'd flat on axis 20-20Khz and there is still a changing SPL at the rear of the speaker ?
There is no conservation of SPL around the speaker. The radiation pattern is changing as shown in post#31 where the on axis is always 0dB and the relative attenuation (dBr) and radiation shape can be read off the polar coordinate plots.
That's why I included curve in pic#2 which shows the absolute levels at 0deg, then the others are just relative to it. There is also another set of absolute curves in post #33 for various drivers and cabinets.
There is a problem with seeing the 0 degree axis as a reference level. It might not be so bad if the spread is smooth enough, but a box is not a particularly smooth shape.
What do you recommend for answering the OP's question "what is the attenuation at the back of a speaker" ?
All I'm saying is what you already know. Some of the energy is diverted modally and it's not a matter of giving a simple number. A box doesn't spread the energy in a smooth manner.
Here I wanted to show the potential of the 0 degree axis to become uncertain in such an environment. Depending on the situation is it often more appropriate not to normalise.

Here I wanted to show the potential of the 0 degree axis to become uncertain in such an environment. Depending on the situation is it often more appropriate not to normalise.
Murphy's f3 presents the frequency where spl difference is 3dB - it is halfway in dB to full baffle step/loss! The problem is angle and shape of the curve, it may take 3-5 octaves to develop to full 6dB. The rearside dispersion varies even more based on many factors, particularly at higher frequencies than f3 of BS.
This is why spl at 180 deg at f3 is useless info as such (IMO). I still don't get what is the point of knowing (theoretical) 180deg spl loss (singularly). Seems like everybody else than OP share this confusion.
Here is Edge sim of how axial response varies with baffle height, while smallest dimension remains the same 200mm. Murphy's formula for f3 doesn't work....
Last edited:
- Home
- Loudspeakers
- Multi-Way
- relative SPL front and back of a speaker at the baffle step frequency