Jan, Graham Maynard more than 15 years ago tried to open the eyes of you and many others to the first period distortion (FCD), but nobody understood anything.
Everybody understood exactly what he was trying to say, just as we understand exactly what you are trying to say. It is not rocket science. It is just wrong.
But I very well understand that this far in the game, you are unable to even think about being wrong, because all you did so far will become at once worthless. Your ego would not survive.
Therefor, you are condemned to continue to repeat the same wrong stuff for as long as you will be active on this forum, without changing anything.
Think about what you could do with all that time and effort!
Jan
Last edited:
I could have used infinite slew rate sq wave since petr_2009 includes infinite harmonic series in his test signal. The rise time is 100nS as he is touting extended bandwidth. It appears he is happy with distorted square waves.
My exchange with Bob Cordell on slew rates did not make a dent. Neither does John Curl suggesting a practical upper limit of 100V/uS. Slew rate in my world is at the load, not some marketing figure.
To make it realistic you should put the square wave through a low pass filter that makes it more like audio. Maybe a simple RC that has an Fc of say 30kHz. That will show more the real life situation.
It is also more in line with for instance the way a DIM30 test signal is set up.
Jan
There is no point in making the test signal realistic. Its purpose is to test the amp's stability. Bandwidth limiting should be performed by the amp. But if you do this, FCD will occur, according to petr_2009. In his world there is no realistic signal. Therefore, he has to stand by his self-imposed requirements. The current requirement has simply been ignored.
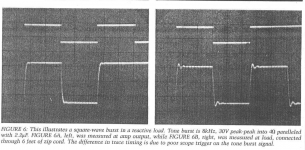
I am highlighting the nonsensical situation. The test signal and 8R+2uF is one that Hugh Ford regularly used for bench tests in Studio Sound magazine. It was also used by others when amp testing was done properly. His test regime to this day is far more rigorous than the half-baked tests in Stereophile, Hi-Fi News and other publications.
The test signal is the test signal. The amp needs to respond appropriately. Still no square wave plots from petr_2009 and current measurements for the test load above.
Last edited:
The problem with such a test signal is that the response varies with the speaker cable and the measurement wiring to mention just two factors that have nothing to do with the amplifier performance yet have a strong influence on the outcome.
I already found that out in 1983 😎
Jan
I already found that out in 1983 😎
Jan
Attachments
Testing is about isolating the device under test. Otherwise it is a useless test.
petr_2009 submitted a square wave from a CD player???? What happened to the FCD in the CD player?
petr_2009 submitted a square wave from a CD player???? What happened to the FCD in the CD player?
Musings on amp design... a thread split.
spladski
The test signal is the test signal. The amp needs to respond appropriately. Still no square wave plots from petr_2009 and current measurements for the test load above.
Spladskl, I brought this test in a post, but you did not understand anything, or pretend that you did not understand
Musings on amp design... a thread split.
I spread the test again separately for each load capacity
Attachments


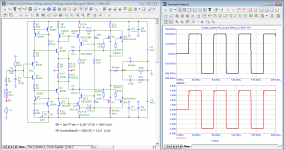
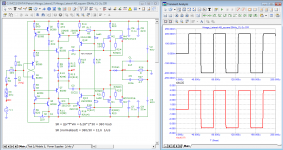
Your test was from a CD player. Are you claiming that your square wave plots represent 380V/us into 8R+2uF?
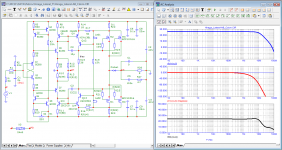
Judging by the loop gain graph, your model is far from reality. My gut tells me that Cherry had a single gain frequency in the region of 700-900kHz, which is evident from the phase rebound and the step formed on the amplitude characteristic with a slope of 20dB/dec. You probably have an extra 10dB at high frequencies added somewhere.Recently simulated a 1983 Cherry circuit (60W NDFL Power Amplifier).Here are additional test results that you won't find in any book on audio technology.
the release of the group delay outside the audio band leads to additional distortions of the first period
As an engineer, Mr. Cherry obviously used a rectangular signal test when setting up to assess the stability of his scheme, but you did not do it or simply did not bring it, although it would have been worth doing. This would make it obvious that the model and the real device do not match, since a well-visible undershot would appear on the step response
Don't flatter yourself, you are also far from sound engineering. Pulse signals are used, it is true, but to assess stability, and not to measure distortion. These are two different categories of tests, do not put everything that comes into your hands in one pile.I am more and more amazed at how many people here are far from sound engineering. Pulse signals are widely used in audio frequency amplifier tests: from rectangular signals, triangular signals to bursts of sinusoidal signals.
His developments are recognized as one of the best in sound quality in the world.
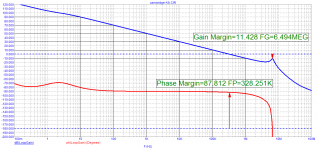
If we compare the Bode diagram, we can see that the amplifiers have the same parameters: a gain of 26 dB and approximately the same time Propagation Delay.
The frequency of the first pole of the PIRET-96 amplifier is slightly higher than 2 kHz, and the Hiraga amplifier is an order of magnitude higher.
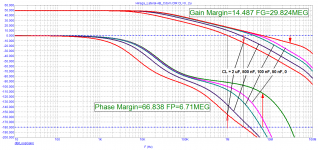
Phase and gain margins are approximately the same.
The loop gain in the sound band of the PIRET-96 amplifier is higher (up to a frequency of 2 kHz - by 20 dB).
Despite approximately the same cascade modes and a higher loop gain at a frequency of 20 kHz, the PIRET-96 amplifier has a much higher level of distortion introduced by it.
You are comparing amplifiers at the same output amplitudes, but one of them still has a margin left before the clip, and the second is almost there, judging by the third harmonic. Reduce the amplitudes by 5V for a margin and try to repeat the distortion test. Perhaps the results will be different and it seems to me that you have jumped to conclusions.
fagos:
“You are comparing amplifiers at the same output amplitudes, but one of them still has a margin left before the clip, and the second is almost there, judging by the third harmonic. Reduce the amplitudes by 5V for a margin and try to repeat the distortion test. Perhaps the results will be different and it seems to me that you have jumped to conclusions. ”
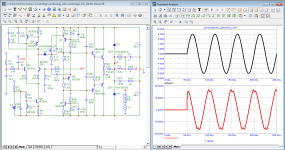
you are right, rich experience in development is felt. I reduced the output voltage of one amplifier and increased the output voltage of the second one almost to the point of clipping. The second amplifier, even at the clipping threshold, has the third harmonic 100 times less than that of the first.
“You are comparing amplifiers at the same output amplitudes, but one of them still has a margin left before the clip, and the second is almost there, judging by the third harmonic. Reduce the amplitudes by 5V for a margin and try to repeat the distortion test. Perhaps the results will be different and it seems to me that you have jumped to conclusions. ”
you are right, rich experience in development is felt. I reduced the output voltage of one amplifier and increased the output voltage of the second one almost to the point of clipping. The second amplifier, even at the clipping threshold, has the third harmonic 100 times less than that of the first.
Attachments

the elements of the nested feedback loop include correction capacitors C2 (C3). This amplifier works just as well with the Miller Cdom capacitor.
Attachments

That's the compensation caps for both the inner and outer loops, but you haven't found the inner loop yet...
peufeu,
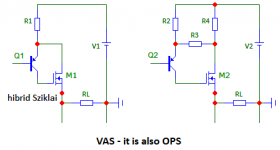
Voltage stage (VAS) - it is also a current stage or output stage (OPS) is made on a hybrid Shiklai transistor with current feedback. Usually, a composite Darlington transistor is considered as one transistor. The Shiklai composite transistor is considered similarly. But you can approach it differently - consider that these are two cascades covered by a nested current NFB loop.
Voltage stage (VAS) - it is also a current stage or output stage (OPS) is made on a hybrid Shiklai transistor with current feedback. Usually, a composite Darlington transistor is considered as one transistor. The Shiklai composite transistor is considered similarly. But you can approach it differently - consider that these are two cascades covered by a nested current NFB loop.
Attachments
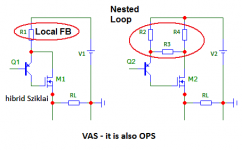
Yes, this thing is going to have massive open loop gain at low frequency because the output device is a MOSFET.
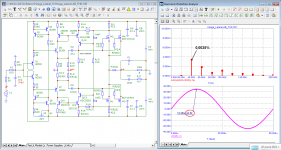
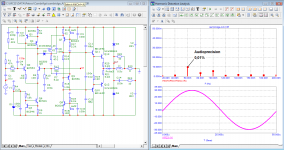
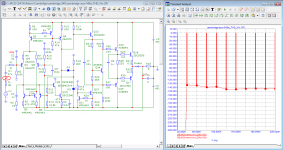
If we neglect Othal's conclusions in relation to the frequency of the first pole, then typical representatives of the "English rational sound" such as Cambridge A3i (developed in 1996) are obtained.
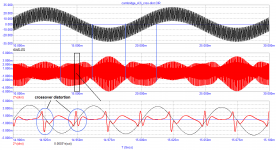
Characteristic features at 8 ohm load:
Loop gain throughout the audio range and far beyond is typical of an ideal integrator and has a phase shift of 90 degrees. The output impedance has a triangular (sawtooth) character and is also shifted by 90 degrees with respect to external influences in the entire audio range.
Has a large loop gain at subsonic frequencies.
The signal propagation delay (tPD) is approximately 5 times the maximum allowable (100 ns) for high quality sound reinforcement.
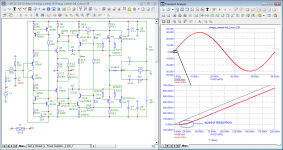
Switching distortion contains higher harmonics with an amplitude of up to 0.03% (-70 dB) and cannot be effectively suppressed.
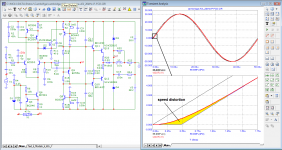
In the steady-state mode, in the spectrum of a signal with a frequency of 20 kHz, the level of the third harmonic is 0.01% or -80 dB, while in the first period there is a wide spectrum of higher harmonics with a level of more than 0.1% (-58 dB).
The output stage has a low load capacity, so when the load impedance drops (for example, up to 2 Ohm), all types of distortions increase tenfold.
Characteristic features at 8 ohm load:
Loop gain throughout the audio range and far beyond is typical of an ideal integrator and has a phase shift of 90 degrees. The output impedance has a triangular (sawtooth) character and is also shifted by 90 degrees with respect to external influences in the entire audio range.
Has a large loop gain at subsonic frequencies.
The signal propagation delay (tPD) is approximately 5 times the maximum allowable (100 ns) for high quality sound reinforcement.
Switching distortion contains higher harmonics with an amplitude of up to 0.03% (-70 dB) and cannot be effectively suppressed.
In the steady-state mode, in the spectrum of a signal with a frequency of 20 kHz, the level of the third harmonic is 0.01% or -80 dB, while in the first period there is a wide spectrum of higher harmonics with a level of more than 0.1% (-58 dB).
The output stage has a low load capacity, so when the load impedance drops (for example, up to 2 Ohm), all types of distortions increase tenfold.
Attachments
-
 07_campridge_A3i_20kHz-Rout.png82 KB · Views: 105
 -
 06_campridge_A3i_cross-distortion.png36.1 KB · Views: 97
 -
 05_campridge_A3i_20kHz-FCD.png87.2 KB · Views: 96
 -
 04_campridge_A3i_20kHz.png80.7 KB · Views: 228
 -
 03_campridge_A3i_20kHz_speed-dist.png92.4 KB · Views: 230
 -
 02_campridge_A3i_Loop-Gain.png36.2 KB · Views: 235
 -
 01_campridge_A3i_Bode.png85.3 KB · Views: 247
while in the first period there is a wide spectrum of higher harmonics with a level of more than 0.1% (-58 dB)
... which, as most of us know, is part of the input signal 1st cycle start-up used in this sim, and is not generated by the amplifier.
Let's try to stay honest.
Jan
... which, as most of us know, is part of the input signal 1st cycle start-up used in this sim, and is not generated by the amplifier.
Let's try to stay honest.
Jan
This amp is trash, but it's not because open loop gain is too high, it's because it is way too low 😀
Jan:
«... which, as most of us know, is part of the input signal 1st cycle start-up used in this sim, and is not generated by the amplifier.
Let's try to stay honest.»
Jan, if I understood correctly, you (as well as the majority) do not know anything, so there is no need to answer for everyone. I have already shown generator distortions, I will have to show it again
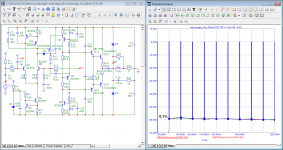
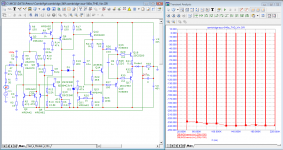
Here is the output impedance of the generator.
If we look at the signal from the generator output, then the harmonic level is below -230 dB.
When we look at the signal after the resistor Ri simulating the output impedance of the generator, the harmonic level is significantly higher due to the input impedance curve of the amplifier. However, it is below -130 dB.
«... which, as most of us know, is part of the input signal 1st cycle start-up used in this sim, and is not generated by the amplifier.
Let's try to stay honest.»
Jan, if I understood correctly, you (as well as the majority) do not know anything, so there is no need to answer for everyone. I have already shown generator distortions, I will have to show it again
Here is the output impedance of the generator.
If we look at the signal from the generator output, then the harmonic level is below -230 dB.
When we look at the signal after the resistor Ri simulating the output impedance of the generator, the harmonic level is significantly higher due to the input impedance curve of the amplifier. However, it is below -130 dB.
Attachments

- Home
- Amplifiers
- Solid State
- Musings on amp design... a thread split