^Holiday trip around southwest Finland; Inkoo-Mustio-Tammisaari-Hanko-Salo-Kemiönsaari-Turku-Kaarina-Rauma and back home. Total 1451 km by holy Ford automobile.
^Holiday trip around southwest Finland; Inkoo-Mustio-Tammisaari-Hanko-Salo-Kemiönsaari-Turku-Kaarina-Rauma and back home. Total 1451 km by holy Ford automobile.
good trip, all the best.
If anyone want to explain where, in wich point to meassure 4 way speaker, I was read somewhere must be in the middle of speaker enclosure, but am not sure.
Thanks
yes, I was read all, but never see how to measure all speaker driver together in far field measurments.
Thanks
never see how to measure all speaker driver together in far field measurments.
In anechoic room at ~2.5m on design axis which is entirely your decision. That response is hor=0 ver=0 if you decide to measure also off-axis responses in horizontal and vertical planes.
In anechoic room at ~2.5m on design axis which is entirely your decision. That response is hor=0 ver=0 if you decide to measure also off-axis responses in horizontal and vertical planes.
ok, thanks, because spl is different in defferent point of speaker box.
^Enclosure design is not okay if there's significant difference below top octave in horizontal off-axis responses within typical box width at listening distance. Measurement elevation is more critical with multi-way with non-coaxial drivers. Typical mic elevation while far field measurements in horizontal plane is equal to designed i.e. simulated (average) listening elevation.
Common challenge is to get anechoic conditions to far field measurement distance at >=2.5m. Therefore simulation to virtual listening is probably more reliable and useful than total SPL at listening distance measured indoors. Sum far field measurement of complete speaker is okay for verifying some basic things such as polarities, levels and dsp delays - that parameters entered to simulator are correct, but otherwise crossover simulation can be considered as "certified final".
Common challenge is to get anechoic conditions to far field measurement distance at >=2.5m. Therefore simulation to virtual listening is probably more reliable and useful than total SPL at listening distance measured indoors. Sum far field measurement of complete speaker is okay for verifying some basic things such as polarities, levels and dsp delays - that parameters entered to simulator are correct, but otherwise crossover simulation can be considered as "certified final".
^Enclosure design is not okay if there's significant difference below top octave in horizontal off-axis responses within typical box width at listening distance. Measurement elevation is more critical with multi-way with non-coaxial drivers. Typical mic elevation while far field measurements in horizontal plane is equal to designed i.e. simulated (average) listening elevation.
Common challenge is to get anechoic conditions to far field measurement distance at >=2.5m. Therefore simulation to virtual listening is probably more reliable and useful than total SPL at listening distance measured indoors. Sum far field measurement of complete speaker is okay for verifying some basic things such as polarities, levels and dsp delays - that parameters entered to simulator are correct, but otherwise crossover simulation can be considered as "certified final".
ok, Thanks, I understand, have 4db diferencies in the crossing point between tweeter and midrange, but problem was in design, Thanks
Kimmo,
despite I read documention. looked for youtube merger lesson , checked links above for measuring setup using ARTA.
But still not able to understand merger idea and rules when one scale nearfiled and farfield.
per guide:
Settings in Impulse response measurement / Signal recording window, Sweep tab:
Sequence length 256k
Sampling rate (Hz) 88200
Output volume -20 dB
Where in merger or in impulse response converter these -20db plays role and should
be set?
P.S. while I tried to merge responses for woofer and initially measured -20db nearfield, then scaled +20db when converted IR->FR then in merger after setting diameter and distance for far field measurement again i had to scale nearfield again -20db ( sounds very funny ) - this suite made results as expected with manufacturer specs. looks like magic, but still not understand the point above.
In anechoic room at ~2.5m on design axis which is entirely your decision. That response is hor=0 ver=0 if you decide to measure also off-axis responses in horizontal and vertical planes.
Can I have that puppy ? 🙂 ( In your profile picture !)
Can I have that puppy ? 🙂 ( In your profile picture !)
Sorry. Puppy is not so puppy anymore (7 months now) and owner is my wife - who is not Pavlov as far as I know.
Where in merger or in impulse response converter these -20db plays role and should be set?
Nowhere if you're using ARTA, because measured level divided reference channel level stays constant in dual channel mode when volume is decreased with ARTA's signal generator. So magnitude scaling of both LF and HF part could be 0.0 dB despite of different signal levels.
My video lessons and instructions could have some details which are not totally compatible with ARTA because measurement data is usually captured with CLIO 10-12. Some mistakes are also possible, but I will try to find and fix them in the next revision.
Kimmo, thanks
Well I see the answer is possible only if the one understands theory of measurements.
I played with your programm few hours, looks smart and intelligent and it broken my dreams about FR for different filters and real speakers. I just imagine how much time it would save If send it to past. You done great thing.
Had a quick play with the enclosure simulator tool today for the first time and I have to say I'm a bit puzzled, and not sure if I've encountered a bug or two. I tried simulating a driver I actually have - a Visaton W300S 8 ohm which convieniently is already in the database. 🙂
With a 125 litre bass reflex enclosure and 25Hz port tuning I get the following:
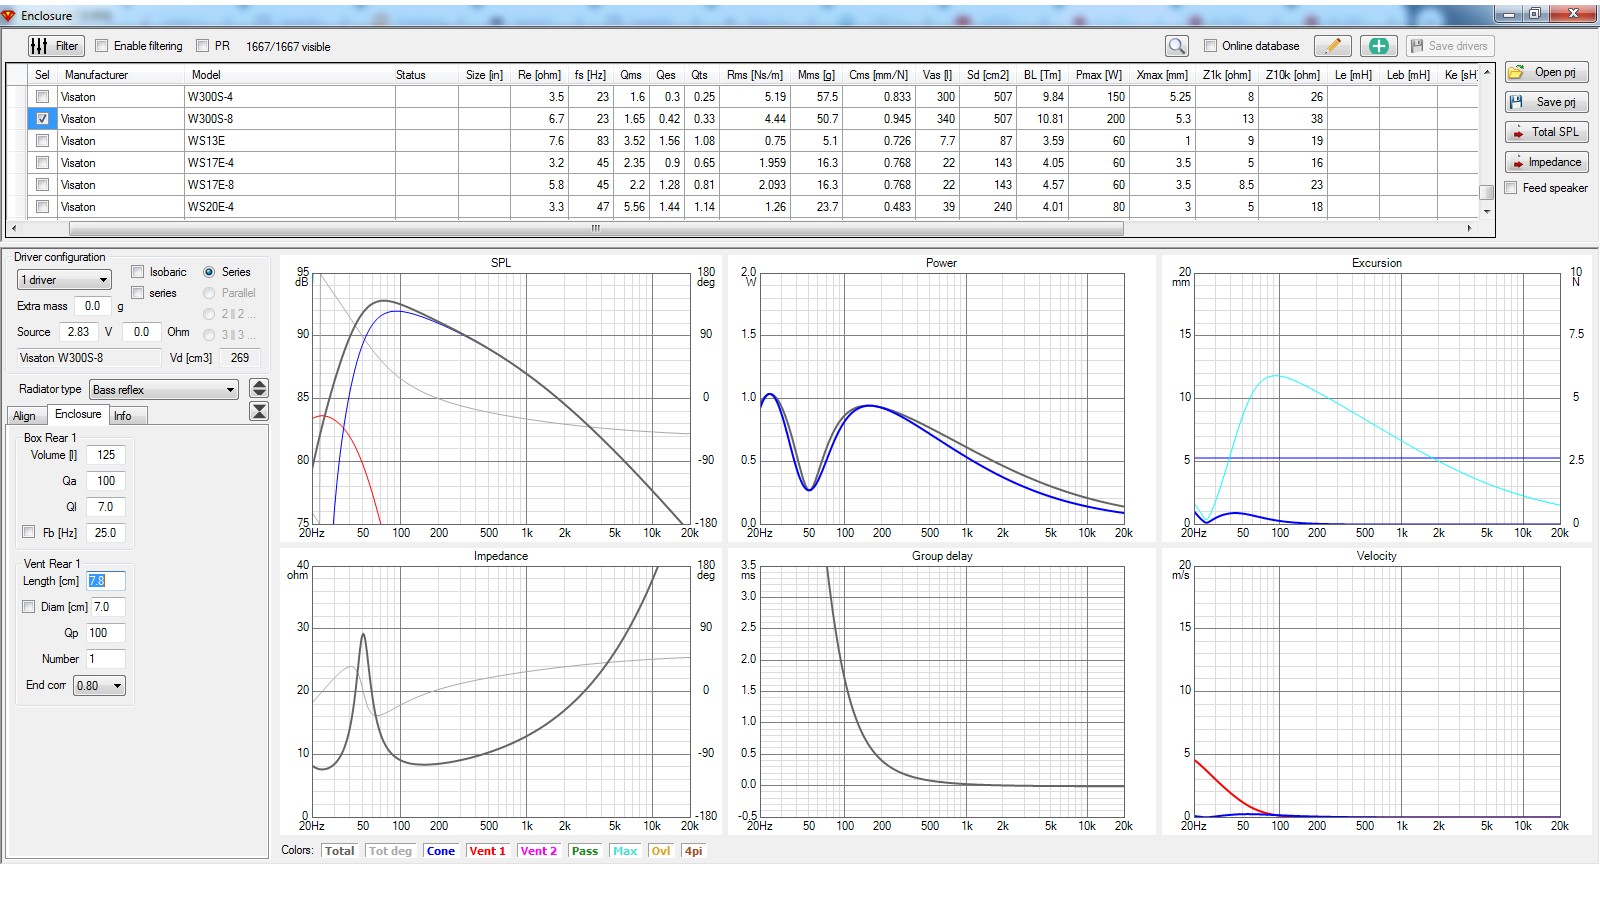
The thing puzzling me is the severe downwards slope in SPL with increasing frequency shown in the top left graph amounting to about 6dB down at 1Khz.
What is the SPL graph supposed to represent if not on axis response into half space ?
It looks almost as if the tool is naively using the voice coil inductance to attenuate the high frequency response assuming that the driver output is proportional to current at high frequencies - which of course it is not.
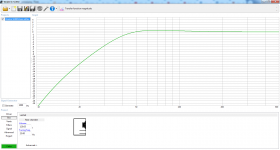
If I model the same driver in WinISD I get the expected result:

I checked the documentation (just this once 😀 ) and note that page 28 of the english version shows an SPL graph that I would expect that is flat at high frequencies. (Given only T/S data and no high frequency measurement of the driver)
Any ideas what is going on ?
Also a second problem I've encountered is that after manipulating the values for the box/switching between closed/bass reflex etc for a couple of minutes the graphs have all "frozen" and no longer respond to any changes made on the GUI on the left side - I can even change it to closed box and it still shows the bass reflex alignment in the graphs.... 😕
With a 125 litre bass reflex enclosure and 25Hz port tuning I get the following:
The thing puzzling me is the severe downwards slope in SPL with increasing frequency shown in the top left graph amounting to about 6dB down at 1Khz.
What is the SPL graph supposed to represent if not on axis response into half space ?
It looks almost as if the tool is naively using the voice coil inductance to attenuate the high frequency response assuming that the driver output is proportional to current at high frequencies - which of course it is not.
If I model the same driver in WinISD I get the expected result:
I checked the documentation (just this once 😀 ) and note that page 28 of the english version shows an SPL graph that I would expect that is flat at high frequencies. (Given only T/S data and no high frequency measurement of the driver)
Any ideas what is going on ?
Also a second problem I've encountered is that after manipulating the values for the box/switching between closed/bass reflex etc for a couple of minutes the graphs have all "frozen" and no longer respond to any changes made on the GUI on the left side - I can even change it to closed box and it still shows the bass reflex alignment in the graphs.... 😕
Attachments
Last edited:
I checked the documentation (just this once 😀 )
User manual, in the middle of page 31:
"Voice coil inductance (with losses) is included in frequency response calculation by checking Show effect of inductance in context menu of SPL chart.
Flat SPL at HF is shown by unchecking, which might be expected by common citizen but not so much fact because inductance reduces current which reduces force and so on. Typical problem is that proper extended (lossy) inductance model parameters Le, Leb, Ke, Rss or Z1k and Z10k are not entered for the driver. Le alone is not good for SPL calculation. You can test SPL effect of advanced impedance model e.g. with Scan-Speak 10F/8424G00.
Visaton W300S-8 seems to have Z1k=13 Ohms and Z10k=38 Ohms (instead of single Le) in driver database. Impedance curve with some semi-inductance is approximated with exponent function by those two values. Main part of Visaton data is imported from some German enclosure simulator "as is". SPL curve with simple Z model matches with that tool.
Whoops...User manual, in the middle of page 31:
"Voice coil inductance (with losses) is included in frequency response calculation by checking Show effect of inductance in context menu of SPL chart.
 I keep forgetting to check the context menus...
I have to completely disagree here - the "show effect of voice coil inductance" setting is based entirely on a faulty premise and therefore doesn't give valid results.Flat SPL at HF is shown by unchecking, which might be expected by common citizen but not so much fact because inductance reduces current which reduces force and so on.
Yes, impedance rise with frequency caused by voice coil inductance reduces current and therefore SPL at higher frequencies compared to no inductance, that's simple ohms law - but the effect of the voice coil inductance on SPL is already taken into account in the design of the driver and the published frequency response curve of the driver which is based on the driver being voltage driven from a low impedance souce not current driven from an infinite impedance source...
Nearly all cone drivers that you would use in a box simulator are designed to give as flat as possible frequency response with voltage drive from a low impedance source - they aren't designed to be flat when current driven.
In a well designed cone driver the increasing directivity of the driver at higher frequencies compliments the reduction in drive current due to inductance to give an overall flat frequency response on axis when voltage driven which neither trends down or up until the final cutoff frequency.
In fact without this inductance many cone drivers would actually have a rising response at high frequencies. A good example is comparing the response of the Fostex FE207 and FE206E - both drivers have the same cone design but the FE206E has a shorting ring to dramatically reduce inductance while the FE207 does not. As a result the on axis high frequency response of the FE206E is tipped up by nearly 10dB due to the very low inductance, compared to the FE207 with a more normal inductance which has a more neutral high frequency response.
By calculating the effects of impedance and then applying it to the predicted frequency response you are effecively applying this correction twice resulting in a steep downwards SPL slope that simply doesn't exist in reality. (If the driver had zero inductance the high frequency response would have actually trended up at high frequencies, at least until the high frequency cutoff of the driver)
Look no further than the manufacturers published frequency response of the W300S 8 ohm to see that - it's not 6dB down at 1Khz, that's for sure. In fact it's remarkably flat up to 1Khz for a 12" woofer, (only on axis of course) one reason I like them as a driver.
The problem with trying to predict the effects of voice coil inductance at high frequencies is that the software doesn't have all the information it needs.
It only has T/S parameters including inductance - from that it can calculate low frequency response but it knows nothing about the high frequency response of the driver as it is not modelling things like shifts in directivity that counteract and compensate for the impedance change, or any other mechanical or accoustic properties that might cause the on axis response to increase with frequency with a constant current drive. (Progressive cone decoupling is another)
In other words, the "show effect of voice coil inductance" setting is simply guessing based on a lack of information, and guessing wrong. For that reason I don't understand its inclusion let alone it being enabled by default.
A box simulator that only has Theile/Small parameters available to work from should make the assumption that the high frequency response of the driver tends towards a flat 0dB response at high frequencies when voltage fed from a low impedance source. This is what all other software I have used before does, and it's the only logical thing to do without additional data being available.
To get any more detailed than that at high frequencies, actual accoustic measurements would need to be merged with the calculated alignment response.
Typical problem is that proper extended (lossy) inductance model parameters Le, Leb, Ke, Rss or Z1k and Z10k are not entered for the driver. Le alone is not good for SPL calculation. You can test SPL effect of advanced impedance model e.g. with Scan-Speak 10F/8424G00.
Visaton W300S-8 seems to have Z1k=13 Ohms and Z10k=38 Ohms (instead of single Le) in driver database. Impedance curve with some semi-inductance is approximated with exponent function by those two values. Main part of Visaton data is imported from some German enclosure simulator "as is". SPL curve with simple Z model matches with that tool.
The problem is not in the accuracy of the driver parameters - it's the whole underlying assumptions behind trying to "model" the effect of the voice coil inductance on the frequency response when the voice coil inductance effects are already included in the design of the driver and published frequency responses....
Last edited:
Nearly all cone drivers that you would use in a box simulator are designed to give as flat as possible frequency response with voltage drive from a low impedance source
There may be some drivers that are designed like this, but certainly not nearly all cone drivers. It really depends on what a driver is designed for. For instance, a bass driver does not need to have flat response higher than a few hundred Hz.
Yes, impedance rise with frequency caused by voice coil inductance reduces current and therefore SPL at higher frequencies compared to no inductance, that's simple ohms law - but the effect of the voice coil inductance on SPL is already taken into account in the design of the driver and the published frequency response curve of the driver which is based on the driver being voltage driven from a low impedance souce not current driven from an infinite impedance source...
Now you're talking about actual drivers in practice. Not ideal piston with current driven motor. Enclosure tool tries to play both of those, but user is responsible to select which SPL curve is shown and exported. For example I never look SPL curve with impedance effects because it's not very practical approach and useful for purpose of enclosure simulation (which is driver selection and box dimensioning). Basic simulators are not able to simulate HF response so that range is quite useless no matter is there some Z effects or not.
- Home
- Design & Build
- Software Tools
- VituixCAD