Does "may-be" mean, to you, the same as "maybe"?
Perhaps he meant "peut-être".
Edit: Dang, cross-posted again.
And my point is that if you know a little French, then T's hyphenated English makes sense.
Last edited:
Zung, the tweeter is in phase. Look at what comes first in time.
You're right, of course. Eyeballing the graph, the tweeter kicks in, then returns more energy than received, then, about .1mS later, the woofer wakes up. That means the woofer is about an inch or so behind the tweeter, a very likely scenario. I was misled by the undershoot which is higher in magnitude.
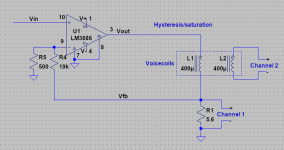
As Demian requested here are some schematics showing what I want. jneutron, can you tell me how to change one of these to reflect your proposed test? Then you won't have to repeat it over and over again...
If you can't do all the tests, do at least jneutron's test.
Still not quite sure which frequencies are best for the braking test. Maybe PMA has a better grasp on the issue of sidebands than I do.
If you can't do all the tests, do at least jneutron's test.
I want the .wav file so I can open it in DiAna (needs single tone) and/or LTspice. I usually want at least 20 seconds, but the more the better, especially at low frequencies. Sometimes I just leave it recording until I feel like it.
Hysteresis/saturation test:
1: lock the voicecoil
2: drive the first coil with current drive
3: record the drive current and second coil voltage, hysteresis can be extracted in software.
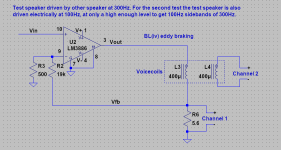
BL(iv) eddy braking test:
1: Drive the speaker with another speaker at 300Hz and record the second coil voltage.
2: Repeat, but with a LF current drive say 100Hz of the first coil, recording the second coil voltage. Use as low a current as possible to get a measurable result. Eddy current braking modulated with the LF current should be observable with the cone velocity being reflected as 100Hz sidebands of 300Hz in the EMF.
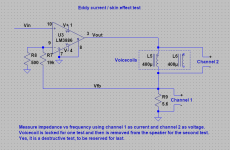
eddy current / skin effect test:
Measure the TS parameters beforehand if possible.
1: Measure impedance vs frequency with the voicecoil locked, in addition to LCR meter reasing at as low a frequency as you can get a reliable inductance reading at.
2: Measure impedance vs frequency with the voicecoil outside the magnet, also in addition to LCR meter reading at the same frequency as the previous LCR reading.
This should tell us about skin effect in the voicecoil and eddy current impedance in the magnet.
Ideally I would like to be able to extract inductance vs frequency from these measurements, which is easier if you can provide CSV files (or if you can do it with your software, make real vs imaginary impedance vs frequency charts).
Still not quite sure which frequencies are best for the braking test. Maybe PMA has a better grasp on the issue of sidebands than I do.
Attachments
PMA, if you can make a graph for the W18 showing the phase of the IMD harmonics minus the frequency response phase and normalized to frequency response, this will probably give me some clues about the sources of the distortions (if you're up to it of course). Since the magnetic nonlinearities and the signal both act on the cone through the voicecoil, I don't expect this test to be confounded by acoustic path differences.
If one cannot hear signal absolute polarity, then how can one hear driver polarity, it's impossible....😉......PMA, you are right when it comes to classical music. The Sequerra Met7's are not optimum, because they lack both extreme lows, extreme highs, etc. BUT their TIME RESPONSE, is pretty darn good! And I hear it. .... The LS3-5A's just sounded more natural on human voice. Darn! Today, I find the Sequerra Met 7's to sound pretty good also with human voice, and as long as I do not play them too hard, the distortion seems reasonable to me. I use them mostly for voice anyway. What I wanted to discuss with you, PMA, was the difference in time response between the Sashas and the Sequerra's and how it could change the sound. I suspect that I asked too much, and you don't think it that important. Oh well.
Dan.
As Demian requested here are some schematics showing what I want. jneutron, can you tell me how to change one of these to reflect your proposed test? Then you won't have to repeat it over and over again...
If you can't do all the tests, do at least jneutron's test.
Still not quite sure which frequencies are best for the braking test. Maybe PMA has a better grasp on the issue of sidebands than I do.
I don't know a way to lock the cone that is nondestructive. I'll set up to do JN's tests tomorrow if I don't get sidelined. Your tests are more involved. I may be able to drive with another speaker nearby and look at what happens with amp connected and not connected. . . I can measure the acoustic SPL at the speaker during the measurement. Will that be useful?
It's better to keep the amp connected and just turn the 100Hz input on or off, then the speaker sees the same impedance in both tests. I think the SPL would still be useful.
If one cannot hear signal absolute polarity, then how can one hear driver polarity, it's impossible....😉.
Dan.
OK, then make an allpass phase distortion test
Audibility of allpass phase distortion (test)
and show your result on a drum sample
Audibility of allpass phase distortion (test)
without excuses that foobar ABX plug-in modifies the sound 😀.
PMA, if you can make a graph for the W18 showing the phase of the IMD harmonics minus the frequency response phase and normalized to frequency response,
I can do it, later, for a single tone distortion test. REW does not show phase of harmonics in the IMD test.
If you fully saturate the gap, your home!
//
Did you mean "you're home"... 😀
Pavel, I have stated my findings regarding Foobar itself and Foobar ABX and my findings still stand, ie Foobar itself and Foobar ABX both introduce unacceptable noise that is not present in other player softwares.OK, then make an allpass phase distortion test
Audibility of allpass phase distortion (test)
and show your result on a drum sample
Audibility of allpass phase distortion (test)
without excuses that foobar ABX plug-in modifies the sound 😀.
I did take a quick listen to the 1 second samples on VLC Player and yes there is audible difference.
This however is not the same as signal simple polarity inversion which I also find to be perfectly audible on loudspeakers with low order filters or single wideband driver.
Spoken word recorded in damped room/studio is I think the best subjective test when discriminating acoustic polarity.
John Dunlavey was not an idiot.
Dan.
Your sytem just need a tiny bit more of your goop to run foobar and the abx plugin.... my findings still stand, ie Foobar itself and Foobar ABX both introduce unacceptable noise that is not present in other player softwares....
Very nice, thanks.Thank you for your interest in the method....snip...
The problem to be solved at the time was to somehow obtain the instantaneous angular velocity of the engine crankshaft, which was needed for the data analysis, but was missing in the measured data set (and a very expensive one at that). The source for this information was found in the pressure pulsations measured in the exhaust channel of the engine, which are closely related to the crankshaft rotation.
The rest is in the paper.
Feel free to ask questions; I'll do my best to answer them.
Regards,
Braca
I liked the pressure pulse method. I was thinking just trigger off a specific spark plug wire, but duh, diesel. 😱.
In my current work task, 8 of the devices have rotary encoders on the motors, and linears on the load. The rotaries are 1 nanometer (at the load) resolution, the linears are absolute renishaws interpolating to 5 nanometer.
It is absolutely luxurious having that much data at hand, I can see every nuance the drive train has in terms of imperfections. Even better, the motors are torque driven so I can diagnose the train's force requirements, thinks like lubrication, brinneled bearings, magnetic forces. The amazing thing is seeing the magnetic forces compress the 66 mm diameter lead screws so much that their pitch changes such that the error of the linears w/r to the rotary encoders exceeds the position error budget by a factor of 20 in less than 10 mm of move (that thanks to the 3 meter long arrays of neodymium magnets.) The vendor had written the code to use the rotaries in closed loop, and then read the linears to see how close. They were unable to get stability using the linears, and I figured out why..
I'm tossed between publishing all this myself, or having the guys I'm teaching this to write and present at conferences. Some of them (physicists and scientists) must publish to advance here, unlike engineers. And we are all better off if they do it, as they are just starting their careers.
For now, I'm just updating my presentation on the fly, but will eventually break it into 5 or 6 different ones specific to a topic. At 114 pages heavily animated, it's not exactly an hour presentation, more than an hour is a sleeper..and this topic can certainly put one to sleep..
It's that luxury of data combined with my E/M coil stuff that suddenly led me to realize that a DVC speaker gives the opportunity to instrument in real time the in phase voltage component of a speaker drive coil, allowing the use of it in a real time feedback system. Hence my desire to see all the harmonics temporally as I showed previously.
Jn
Last edited:
I do not understand how any physical device can return more energy than it receives. Could you be a bit more specific as to what you mean?You're right, of course. Eyeballing the graph, the tweeter kicks in, then returns more energy than received, then, about .1mS later, the woofer wakes up. That means the woofer is about an inch or so behind the tweeter, a very likely scenario. I was misled by the undershoot which is higher in magnitude.
If this is a two way system, is the quick two spike portion the tweeter bounce off the leading edge, and then the woof overwhelms it?
Jn
This lack of gallery is driving me nuts. Now I have to go back a million posts to recall the exact tests. Sigh..As Demian requested here are some schematics showing what I want. jneutron, can you tell me how to change one of these to reflect your proposed test? Then you won't have to repeat it over and over again...
If you can't do all the tests, do at least jneutron's test.
Still not quite sure which frequencies are best for the braking test. Maybe PMA has a better grasp on the issue of sidebands than I do.
Never thought I'd have to keep an engineering notebook to keep track of an online collaboration..my bad.
Jn
Pavel, this is an unfortunate failure of a test. Manfred Schroeder in about 1976, published a paper in the 'Proceedings of the IEEE' on hearing, and he showed that all-pass test phase shift may be next to impossible to hear, but other aspects of phase shift between loudspeakers, etc, is often audible. You have been 'brainwashed' into thinking that what Max and I hear, for example, is impossible, but this is not correct.
I ordered the Monacor drivers but it may take until next weekend until they arrive. I'm really so exited to make tests with them (after pre-aging).It's that luxury of data combined with my E/M coil stuff that suddenly led me to realize that a DVC speaker gives the opportunity to instrument in real time the in phase voltage component of a speaker drive coil, allowing the use of it in a real time feedback system. Hence my desire to see all the harmonics temporally as I showed previously.
Will try to measure a set of twin tones / multitones with both pure current drive and your scheme. Unless I'm at the edge of my mic and preamp distortion (will make IMD sanity check with two drivers each playing a single sine) I hope to get meaningful results. I think one scheme should provide less acoustic distortion overall, preferably over a wide freq range and general parameter variation (level, notably).
In a second step I look forward to isolate the distortion with a real music signal, subtracting the recording from the source signal convolved by the measured impulse response via log-sweep at an adequate level. It's hard to acheive a deep null with acoustic measurements but we can actually listen to the diff signal and get insight because it magnifies the perceived distortion even when the residual is still dominated by linear differences. Crash-course on distortion character perception, of sorts.
Last edited:
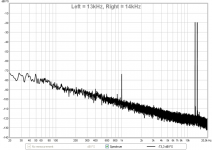
(will make IMD sanity check with two drivers each playing a single sine)
Yes, important.
Attachments
Yes, important.
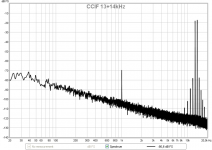
Interesting that the mike picks up the 1khz beat frequency from the two sources.
I believe that to be an artifact caused by the single diaphragm. I also believe that human hearing will not generate that.
This is an important thing to consider with imd tests, as we cannot stop the mike from displaying this.
Jn
- Status
- Not open for further replies.
- Home
- Member Areas
- The Lounge
- John Curl's Blowtorch preamplifier part III