So to my opininion LTSpice gives an excellent alternative to custom fit solutions with scripting languages.
Hans
Hans this is not a contest, we are all donating our time gratis to something which will be made freely available. An LTSpice deck is a script I don't see the difference between editing a SPICE deck and a Python script, the goal in the end in any case is to have no editing once we decide on all the possibilities. Adding a frequency display and IEC wow and flutter filters are trivial exercises. Python has access to a massive library of contributions of the scientific community, LHC and LIGO both use it to develop data reduction algorithms.
If people want to control colors, fonts, line weights, etc. maybe we could have a .init or .defaults text file? That is things like having 1000Hz or 3000Hz as reference would not involve modifying the code.
Good Idea, certainly for center frequency selection.
I think I suggested this once before, but I'll throw it up for discussion again:
Would it make sense to break the Python app off to its own thread? If this is going to be a open-source project, it might make it easier to find the latest version on the OP which is the only post that can be edited long-term. That way, people wouldn't have to scour a long thread to find the latest version amidst numerous iterations.
People could submit their changes to Scott throughout the thread and he could incorporate (or reject) them in the current version, available on the OP, thus maintaining version control as well as documenting progress of the app.
Hi Scott,Hans this is not a contest, we are all donating our time gratis to something which will be made freely available. An LTSpice deck is a script I don't see the difference between editing a SPICE deck and a Python script, the goal in the end in any case is to have no editing once we decide on all the possibilities. Adding a frequency display and IEC wow and flutter filters are trivial exercises. Python has access to a massive library of contributions of the scientific community, LHC and LIGO both use it to develop data reduction algorithms.
I don't know how to interpret your posting. In no way do I see a contest anywhere at the horizon. My contribution was addressed to those not being able to make use of complex tools such as Python and Matlab such as myself.
And as it turned out, this easy road with LTSpice that everybody can take, although maybe not as sophisticated as a custom made piece of software, can be used with good and reliable results.
And what I did took also quite some time and is freely available as well, so what did I miss ??
Hans
Hi Scott,
I don't know how to interpret your posting.
Sorry, I didn't mean to offend but I was hoping to offer a unified package that we can all agree on. The goal is to have it turn key no knowledge of what is behind the curtain required by the user, but we are still in the middle of figuring out what we want. Also the FM track is only one, the goal would be to have a script for every track especially the HTA/azimuth one.
I think LD's frequency vs radius display is very informative, and LTSpice can't do this. As an end goal I don't see the difference, the Anaconda Python install is a point and click and then you simply run the script vs. install LTSpice and sim the circuit representation of the track. To a total nontechnical user both are equally imposing.
Personally I feel dividing the intellectual energy of those that can actually make something useful happen is a non optimal situation. I also find making .ckt files that mimic classical instruments indirect and unnecessarily constraining, but if you are more comfortable with this fine and please don't take any offense at my comments.
Thank you Scott,
I probably made a mistake by reacting when I was just halfway reading this thread, still assuming that measuring TT speed stability was the issue and was not aware that so much more was on the way.
I will first finish reading the whole thread.
Hans
I probably made a mistake by reacting when I was just halfway reading this thread, still assuming that measuring TT speed stability was the issue and was not aware that so much more was on the way.
I will first finish reading the whole thread.
Hans
Hans: I nearly burst out laughing. Matlab is a piece of cake compared to getting useful output from LTspice. And if you can wrangle LTspice (which you can very well) you are going to have no problem with getting python running.
But your method is certainly a welcome proof of concept and I can see cases where, as part of a larger simulation it could be exceedingly useful.
But your method is certainly a welcome proof of concept and I can see cases where, as part of a larger simulation it could be exceedingly useful.
So Tonearm and cartridge resonances affects speed stability. And in my limited understanding I guess it does so by putting variable pressure on grooves/modulations and with that ultimately running of the platter. So wouldn't it be advisable to use heavy platter, good high torque motor and cartridge matching good tonearm ? Are typically mid range turntables good enough for this ? I have Technicsl SL-Q3. And did this funny test : Drag Torture Test . Description : #192
Regards.
Regards.
My opinion is it's best to present both a polar plot and a spectral analysis. The polar plot is a very visual and accessible presentation of variation in pitch in the time domain: this is ultimately how we hear and can quantify pitch variation. Spectral analysis reveals clues about the causes of pitch variation.
For the purpose of identifying the causes of pitch variation, I don't think one has to be too accurate with the spectral analysis: after all, it provides pointers.
The need for accuracy is in the polar plot of instantaneous pitch, and both sets of SW at hand are more than adequate: very good in fact.
I'm not one for IEC normalised/weighted distilled standard figures. I believe this conceals the often ugly and inconvenient truth about pitch variation (and its true causes), and can lead to an illusion that normal playback typically has inaudible pitch variation - which is obviously untrue. Perhaps an artefact of the numbers war era, or a way of avoiding some tricky issues ?
And yes, typical cart/arm resonant instability can be a significant contribution to audible pitch variation. Damping is the answer, BTW, rather than focus entirely on selection of resonant f, as the industry has. And these tools are an excellent means to investigate and tune the issue.
LD
No, headshell position affects linear speed of the stylus relative to platter. Headshell displacement from nominal position directly affects pitch because stylus pivot is fixed, and so the stylus must scrub.So Tonearm and cartridge resonances affects speed stability. And in my limited understanding I guess it does so by putting variable pressure on grooves/modulations and with that ultimately running of the platter.
LD
Last edited:
I am glad that I am not the only one confused about where the Python code has got to in many monthsWould it make sense to break the Python app off to its own thread? If this is going to be a open-source project, it might make it easier to find the latest version on the OP which is the only post that can be edited long-term. That way, people wouldn't have to scour a long thread to find the latest version amidst numerous iterations.
And yes, typical cart/arm resonant instability can be a significant contribution to audible pitch variation. Damping is the answer, BTW, rather than focus entirely on selection of resonant f, as the industry has. And these tools are an excellent means to investigate and tune the issue.
LD
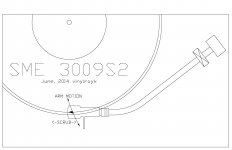
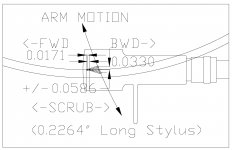
Damping, and tonearm geometry. For a given arm/cart displacement in the horizontal plane, stylus scrubbing (and FM) is intrinsically dependent on the offset angle.
Conventional pivoted arm:
http://www.diyaudio.com/forums/attachment.php?attachmentid=651970&stc=1&d=1513694774
Conventional pivoted arm, with a horizontal displacement +/- 1.5mm (0.0586 inch):
http://www.diyaudio.com/forums/attachment.php?attachmentid=651972&stc=1&d=1513694957
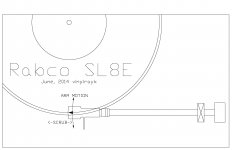
Linear tracker:
http://www.diyaudio.com/forums/attachment.php?attachmentid=651973&stc=1&d=1513695050
Linear tracker, with a horizontal displacement +/- 1.5mm (0.0586 inch):
http://www.diyaudio.com/forums/attachment.php?attachmentid=651974&stc=1&d=1513695099
Full disclosure statement: I am 'biased' towards linear trackers.
Ray K
Attachments
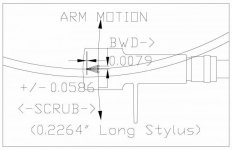
Sorry, here's a better copy of the last image in my post #772.
http://www.diyaudio.com/forums/attachment.php?attachmentid=651981&stc=1&d=1513697887
Ray K
http://www.diyaudio.com/forums/attachment.php?attachmentid=651981&stc=1&d=1513697887
Ray K
Attachments
![SL8E Scrub 3400x2200 [detail].jpg](/community/data/attachments/593/593379-398f197825146df0aef69e03d8a4198e.jpg?hash=OY8ZeCUUbf)
I am glad that I am not the only one confused about where the Python code has got to in many months
I've been waiting on a decision on the test LP rather than incrementally considering every small suggestion. I would suggest possibly creating a separate place once I have a dual display output working well, that is with the spectral plot and useful information like mean RPM, wow/flutter readings, etc.
BTW that feature of a seperate thread didn't occur to me even though I have seen other projects use it.
Last edited:
Any test record with a 3150Hz test tone, or so, would do it. It seems unlikely that the test record 'in development' will have any advantage, because no attention has been paid to hole centering, the principle original reason for doing it.I've been waiting on a decision on the test LP
I'd suggest just going ahead and not linking the SW to any specific test record. Unless there's some commercial reason I don't understand.......
LD
I can get that. I am 'long arm' biased for the same reasons and a variation on compromises.Full disclosure statement: I am 'biased' towards linear trackers.
LD
Any test record with a 3150Hz test tone, or so, would do it. It seems unlikely that the test record 'in development' will have any advantage, because no attention has been paid to hole centering, the principle original reason for doing it.
I'd suggest just going ahead and not linking the SW to any specific test record. Unless there's some commercial reason I don't understand.......
LD
I was referring to the other tracks like HTA and azimuth we want to include as much of a TT setup as we can as well as your suggestions. This is not about only the speed stability.
BTW if you could translate these into a description of the actual track we do want to include them. My references give acceleration on a triwave as depending on the stylus geometry at the peak and even more things like vinyl compliance at the valley.
Triangle/ grooveshape curvature acceleration test 50um 20 deg 500G 15s
Triangle/ grooveshape curvature acceleration test 50um 20 deg 600G 15s...
Groove angle/slew lateral rate test 50um : 15 deg 15s
Groove angle/slew lateral rate test 50um : 20 deg 15s...
Hi Scott,
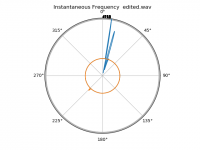
I got your script from post #562 (as well as the other changes you mentioned in the next few posts) and it is plotting something strange. Can you help? For starters, I had a lot of trouble to get the script to open the file in the first place (quotes and all). I'm on a Win7 machine. Here's the wav file:
edited.wav - Google Drive
Thanks!
Attachments
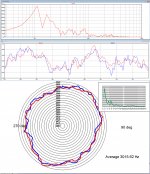
At first sight it looks nice to have a circular display of pitch variation.
However, this way of imaging distorts the data to some degree.
That's why it could be an option for the script that is still under development, to have the choice between linear and cicular displaying the data.
Personally, I prefer the linear way of displaying.
Also the FFT from this data reveals quite a lot more when displayed on a logarithmic scale, this could be another option for the script.
I used the file 12.wav, made available by Ovinyl and processed in a circular way by LD.
You can very well see that the pitch variation data is identical in both images for 2 consecutives revolutions
On the linear dispay, 1mV corresponds to 0.1% pitch variation, just as the circles in the polar display are 0.1% apart.
It is also quite obvious in the logarithmic FFT at the top of the image, that this TT has no 0.55Hz component, but a very strong 2nd and 3rd harmonic at 1.1 Hz and 1.65 Hz.
And the higher harmonics at 2.2Hz, and 3.3 Hz are still visible in this logarithmic image.
Also the resonance of the Cart/Arm looks a bit unusual, maybe they show resp. the horizontal and vertical Fres ?
A lot of information, all hidden when using a linear scale.
Hans
Attachments
Do we know what TT Ovinyl used to record the .wav? Its polar plot seems to have idler drive traits
Last edited:
Hi Scott,
I got your script from post #562 (as well as the other changes you mentioned in the next few posts) and it is plotting something strange. Can you help? For starters, I had a lot of trouble to get the script to open the file in the first place (quotes and all). I'm on a Win7 machine. Here's the wav file:
edited.wav - Google Drive
Thanks!
ra7-
Two things: The level is very low, try increasing the volume of the recording.
There is a ~0.5Sec blank at the beginning of the recording (no audio at all). If you can't edit this out, you need to start the analysis within the software by moving the pointers 1 sec past the beginning.
- Home
- Source & Line
- Analogue Source
- Turntable speed stabilty