That the capacitive aspect is more important than inductive
Why is the capacitive aspect more important than the inductive? It is part of the HF rolloff behavior for sure, but it is not the entire story without knowing the influence of leakage inductance and core (eddy) losses, which are inductive phenomena.
Distortion is determined by core behavior, which predominantly occurs in the regime where the primary is inductive: low frequencies and large amplitudes (= large magnetization swings) go hand in hand with music. On the other hand, capacitance is linear and does not contribute to distortion caused by the transformer.
I don't trust the method as posted in #301. In an actual amplifier, the transformer primary is driven from a tube with Rp in the order of 700 Ohms, yet in the test setup it is terminated by its rated primary load resistance and driven by its rated secondary load resistance. This is not a representative circuit, it aggravates the influence of winding capacitance on the HF rolloff, and results in an increased LF cutoff frequency too. Also, the transformer is measured without DC bias, which increases the influence of hysteresis in the core because the flux changes direction in the test setup, while it doesn't in an actual SE amp. This distortion contribution is thus overestimated. On the other hand, the core doesn't come as close to saturation as in an SE amp, so that contribution to distortion is underestimated.
The datasheet of the Hammond 1627SE gives a primary inductance of 20 H when biased, while the measurement suggests 8.8 H. What is the source of this discrepancy? If I look at the 400 Hz measured impedance, I see that the loudspeaker connection exhibits an impedance of 3.156 k Ohm. This would suggest L=Z/(2*PI*f) or 1.25 H. If I do the same for the 30 Hz point, I arrive at an inductance of 0.74 H. I am looking at the pictures. The impedance transfer ratio of this transformer is 312.5 (2k5 to 8 Ohms), so these measurements suggest a primary inductance of between 231 H and 390 H, which can be what you get when a transformer is not biased and used with a relatively small signal. You're measuring initial inductance, or something entirely different... I am very curious about where the 8.8 H figure comes from, because I can't derive it from the presented plots. The numbers simply don't add up.
I think it is quite likely that all tested transformers will exhibit much better bandwidth when driven from an actual 300B than in the test circuit.
If you use 2x 6k8-5 watt in series, then a 150 ohm -1 watt to ground and you take the signal on this resistor you have around 40 db of attenuation, 100 times.
So if follow the schematic I sent about test set, you need a ss amp ( 20 watt is enough), a 6 ohm resistor minimum 10-15 watt to connect the secondary ( actin as primary now).
On primary ( acting as secondary) you put the resistors: 2 x 6k8 in serie then a 150 ohm, if you put 2,5 volt/ 1 KHz as signal on 6 ohm resistor (1 watt) you will have 120 vac on secondary, with a ratio of 40:1 your test signal is 1,2 volt hat is enough.
Walter
Some answer:
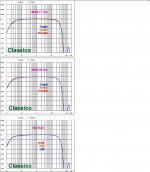
1- In attach some test done with s.e. trafo reagarding freq answer and thd s frequency, with and without bias. There is a test also with a Litz trafo; I have posted them in another thread time ago.
The differences are marginal.
2- in my opinion the capacitive aspect is more important beacuse regarding the L at low frequencies we can obtain a good results with dimension of core ( in general) but the capability to wind with a very good architecture give us a better BW (=less capacitive), that' all.
In every equivalent circuit of trafo at low frequency you have two components, Rdc of coils and L in parallel with tube and for this reason we can understand that the higher is L lower is the THd ( because the tube doesn't have to delivery high current close to the limt =distortion) and better the freq answer.
If you look on Z at 20 Hz you can see that a 20H trafo (FIAT) exibhit 1.2 kohm , the Hammond around 600 ohm; with the 300 B ( suppose 700 ohm) how much is the difference between them in terms of efficency of the circuit?
Walter
Attachments

This double post is my ERROR
Some answer:
1- In attach some test done with s.e. trafo reagarding freq answer and thd s frequency, with and without bias. There is a test also with a Litz trafo; I have posted them in another thread time ago.
The differences are marginal.
2- in my opinion the capacitive aspect is more important beacuse regarding the L at low frequencies we can obtain a good results with dimension of core ( in general) but the capability to wind with a very good architecture give us a better BW (=less capacitive), that' all.
In every equivalent circuit of trafo at low frequency you have two components, Rdc of coils and L in parallel with tube and for this reason we can understand that the higher is L lower is the THd ( because the tube doesn't have to delivery high current close to the limt =distortion) and better the freq answer.
If you look on Z at 20 Hz you can see that a 20H trafo (FIAT) exibhit 1.2 kohm , the Hammond around 600 ohm; with the 300 B ( suppose 700 ohm) how much is the difference between them in terms of efficency of the circuit?
Walter
Last edited:
1- In attach some test done with s.e. trafo reagarding freq answer and thd s frequency, with and without bias. There is a test also with a Litz trafo; I have posted them in another thread time ago.
The differences are marginal.
I don't think the differences are marginal. They may look marginal on a log-log scale, but if I look at the low frequency performance of the "classico" transformer, THD in the bass region jumps all over the place by almost a factor of 10 between the various bias currents. Also, the distortion spectrum is not given, which is something I expect to vary greatly with bias. The litz transformer is doing better, but still displays significant differences. Is everything on the litz the same, or is it an entirely different transformer?
How was bias applied?
When it comes to transformer design, yes, it is more difficult to achieve low capacitance than it is to achieve high inductance. The latter is just a matter of enough turns around a large enough core, while the former requires a lot more effort to get under control. Importance and difficulty are not the same though...2- in my opinion the capacitive aspect is more important beacuse regarding the L at low frequencies we can obtain a good results with dimension of core ( in general) but the capability to wind with a very good architecture give us a better BW (=less capacitive), that' all.
In every equivalent circuit of trafo at low frequency you have two components, Rdc of coils and L in parallel with tube and for this reason we can understand that the higher is L lower is the THd ( because the tube doesn't have to delivery high current close to the limt =distortion) and better the freq answer.
If you look on Z at 20 Hz you can see that a 20H trafo (FIAT) exibhit 1.2 kohm , the Hammond around 600 ohm; with the 300 B ( suppose 700 ohm) how much is the difference between them in terms of efficiency of the circuit?
We are talking about two different mechanisms of distortion. I was talking about distortion generated by the transformer itself because of non-linear behavior of the core. This occurs even when the driving source is perfectly linear, as your latest figures clearly show. On the other hand, the 300B is indeed not a perfectly linear driving resistor, so when it must drive a low-Z inductive load, it will cause excess distortion, even when the inductor is perfectly linear. Both mechanisms will occur together in an amp.
Still, I don't think that the measurement circuit from post 301 gives a representative result for a transformer's frequency response or basic parameters, biased or not. The only right way to do it would be by driving the transformer, in the right direction, with the right source impedance of 700 Ohms, and to measure the secondary response while it is terminated with the rated load. Driving the transformer backwards gives the reverse order of filter elements in the equivalent circuit, resulting in a different (and very probably worse) response. It is the same as taking a loudspeaker crossover filter, swapping its inputs and outputs, and expecting it to yield the same response nonetheless. Also, there is still no explanation why a transformer rated at 20H primary inductance (the Hammond) exhibits an 8.8 H inductance in the measurements. I tend to believe the Hammond data...
About trafo of FIAT it is a proto that I have ask for tests and at the moment and I don't know when it will be available.
I hope soon I think it is a good stuff
ciao
Walter
I hope soon I think it is a good stuff
ciao
Walter
I'm looking OPT for 307A tube for a headphone amp loaded with 300 ohms headphone, so I need to ask them a quote, attached 307A pdf.
What parameters have I to ask to order?
TIA
Felipe
What parameters have I to ask to order?
TIA
Felipe
Some answer to Timpert:
1- every trafo is a reversible stuff in each parameters; the difference are done by real loads connected on primary and secondary; with the our test set you will get exactly how the trafo is playing
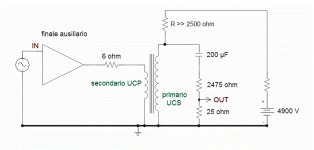
2- the bias was applied with a current generator; in attach the test set .
The 4900 volt is a generator made from Fabrizio for another project and it was used here as current generator. We will implement a new ones more easy.
3- When we have a very low Z at low frequencies the main trouble is the current delivered by tube and not (only) the problem of trafo; in this case it is close to the limit and it will be distorted; in the same way at high frequency, of course
4- Regarding measurement I confirm you that are all exact because are compiant with a simply lcr meter
You can double check this paramente looking at THD vs freq; the Hammond and Sowter exhibit a double THD than FIAT at 20 Hz
Walter
1- every trafo is a reversible stuff in each parameters; the difference are done by real loads connected on primary and secondary; with the our test set you will get exactly how the trafo is playing
2- the bias was applied with a current generator; in attach the test set .
The 4900 volt is a generator made from Fabrizio for another project and it was used here as current generator. We will implement a new ones more easy.
3- When we have a very low Z at low frequencies the main trouble is the current delivered by tube and not (only) the problem of trafo; in this case it is close to the limit and it will be distorted; in the same way at high frequency, of course
4- Regarding measurement I confirm you that are all exact because are compiant with a simply lcr meter
You can double check this paramente looking at THD vs freq; the Hammond and Sowter exhibit a double THD than FIAT at 20 Hz
Walter
Attachments
to Merlin
this is the email
fiat-trasformatori@libero.it.
You can send them the primary and secondary spec and bias current.
Walter
this is the email
fiat-trasformatori@libero.it.
You can send them the primary and secondary spec and bias current.
Walter
1- every trafo is a reversible stuff in each parameters; the difference are done by real loads connected on primary and secondary; with the our test set you will get exactly how the trafo is playing
Walter
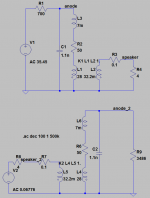
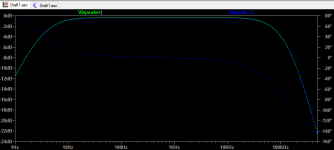
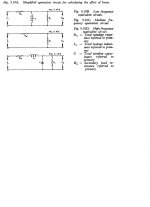
That is true to a large extent, but the results from post 301 are still incorrect, please let me show. Imagine a well documented transformer like the VDV3035SE. I have had this transformer myself, and I can confirm that it meets its specs with great accuracy. In the attached circuit, the upper circuit is the "normal" connection, where the 700 Ohms source impedance represents the 300B. I have taken the datasheet values for leakage inductance, winding capacitance, Rdc, yadayadayada, and I have simulated it in LTspice. The result is an almost perfect match with the published response graphs, and coincidentally, with my own measurements on this transformer as well. The LF -3dB point is at about 3.5 Hz, and the Hf -3dB point is at about 85 kHz. Of course, these are all small signal values.
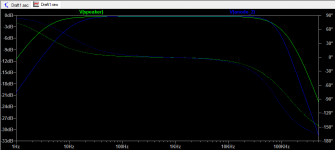
The lower circuit is how you propose to measure the transformer in the reverse direction in post 301. The resulting response is quite different, with an LF -3dB point at 10 Hz and a HF -3dB point at 75 kHz. The LF rolloff has a first-order slope, the HF roloff has a second order slope, but the Q of the slope in the lower circuit is higher, and the phase response is worse, as can be clearly seen in the second attached picture (response.png). V(speaker) is the "correct" response, V(anode_2) is the "reverse" response. I wouldn't call these results the same. The reverse response is quite a bit worse.
You can transform the RDC of the primary and the leakage inductance as series components to the secondary, but not the primary's parallel winding capacitance. That's why you cannot simply reproduce the primary-to-secondary response in the reverse direction, and have the impedance transformation ratio correct as well. You can however get a rather good approximation of the transformer's transfer characteristic by reducing the load resistance to the driving tube's Rp, so in the lower configuration, that would mean reducing R9 to 700 Ohms to represent an average 300B. If you do that, you get the result from the third attached picture (response2.png). They are the same for our purpose, only a nitpicker would would not accept the result as representative because the input impedance as seen by the source is not an exactly transformed version of the input impedance as seen by the 300B.
But now we have a different issue: the load impedance is about a fifth of the normal impedance, so the test can only be done at reduced level if you don't want to overload the transformer.
Attachments
Last edited:

Please leave the simulation.
We are matching the real tests with the simulation; this can have a light importance just to speak but can't be the true.
I am expecting some critics with the same technical approach not with simulations.
I have posted the test after different steps on measuraments on Audioreview lab and in my lab to fix at the best the test set.
And you are wrong about the correct coupling between primary and secondary with the relative load.
I confirm you the the trafo is bi-directional stuff in every case.
Walter
There is nothing wrong with using simulations, since the OPT's equivalent circuits are well known, and match well with real-world performance, even if they are not perfect, they are certainly sufficient for discussion purposes. That's why we really need to see Montanucci's article, perhaps he has some explanations for measuring the OPT "backwards"...
Please leave the simulation.
Why can't a simulation be true? I have indicated that the results match the datasheet and also the measured performance of the transformer. Why would it somehow be invalid when the same simulation is applied to your method? I have shown that you can get representative results with your method when you terminate the transformer with the driving impedance instead of with the rated load resistance, and that's the source of the whole error. My point is that if you don't get the impedances right, the measured performance of the transformer in your setup is significantly worse than the achieved performance in a real amp. That cannot be the intention...
By the way, everything from post 300 onwards has disappeared. Where have these posts gone?
Last edited:
Regarding the trafo for me it is easy to see it as a bi-directional stuff.
On theory, as in attach, the facts are shown
The main reason to play with the test I show is to define exactly the specs of a trafo without other influences.
And is not possible that the simulation has a better credit than real tests!
Regarding the reverse test set in other old thread I have shown othe measurement, please check them
Walter
Attachments
- Home
- Amplifiers
- Tubes / Valves
- OPT Characterization