Thanks for the help in this search! Much appreciated. That Visaton sure looks promising in a few ways. I was viewing the specs of the 10" version only yesterday as JonBocani mentioned it in one of his wild rampages. I remember thinking I should look up the 12" version.
I did not look up the BMS yet, but I will. Thanks for the recommendation.
I guess some simulations are in my near future (again).
Don't forget to look at important datas for sub. W30 is only 50mm voicecoil, 8mm gap and 33mm voicecoil length. BMS is 77mm voicecoil, 10mm gap, 32mm voicecoil length. Both low inductance for such spec, wich minimise non-linearity deviation with excursion. BMS is far better vented. Impedance bump in the 280hz instead of 80hz for the 30w.
On the other hand, the visaton got 65mm voicecoil, with 8mm gap, but only 23mm voicecoil. And moreover, it has 1,7mH inductance, wich is a bit high for a not so long throw sub. In the visation TIW serie the most interesting is the 8" with 30mm voicecoil, but high inductance too.
Another cheap one looong throw, double silicone spider, "but" from ukraine, but high inductance price 128€ here, datasheet, impressive chassis and venting.
Last edited:
...I'll try to work on improving my response and see if I can hear it. It would be cool if there really is an audible difference....
Great enjoy.
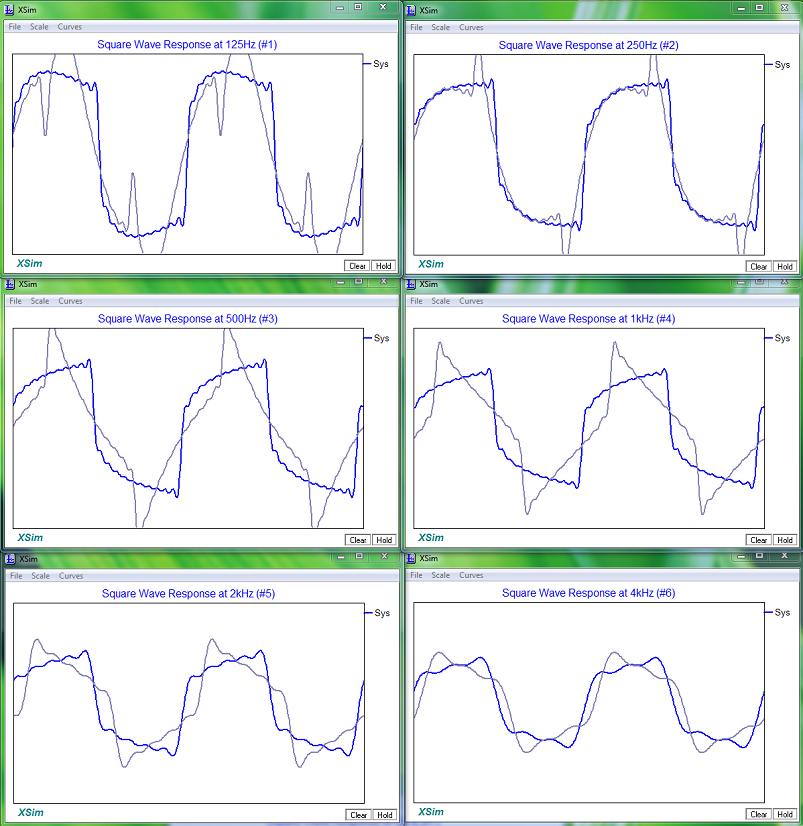
") guessed for your 48dB/oct IRR XO it is LR at 80Hz and adding that slope gives below plot in the middle regarding timing target in APL_TDA:
guessed for your 48dB/oct IRR XO it is LR at 80Hz and adding that slope gives below plot in the middle regarding timing target in APL_TDA:Into XSim blue is tracing of Ronalds system response same as lowest plot above, and grey is same system response plus IRR LR8 XO at 80Hz:
...BTW, the APL software is not stable on my machine. Sometimes, I get identical results on consecutive sweeps, sometimes it is garbage. I don't know how much we should rely on it for accuracy.
Think check "IR" and "NLDA%" button after each sweep, if anything there looks suspicious bloomy then sweep once more until they look clean. Also maybe check I/O in Win7 sound system control panel that it is locked at either 48 or 96kHz before using APL_TDA.
Attachments

Last edited:
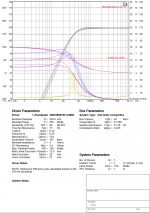
Bassboxx Pro Sim of 12s305 vs 30W
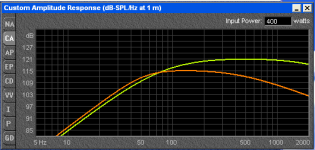
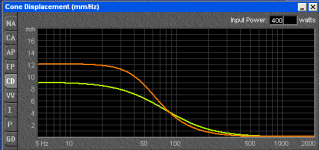
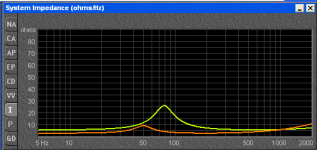
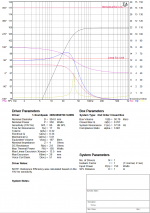
I wanted to see what the difference between the BMS12S305 and Scan 30W would look like so I ran them through Bassboxpro as they are both in the library. BMS is green Scan is Orange.
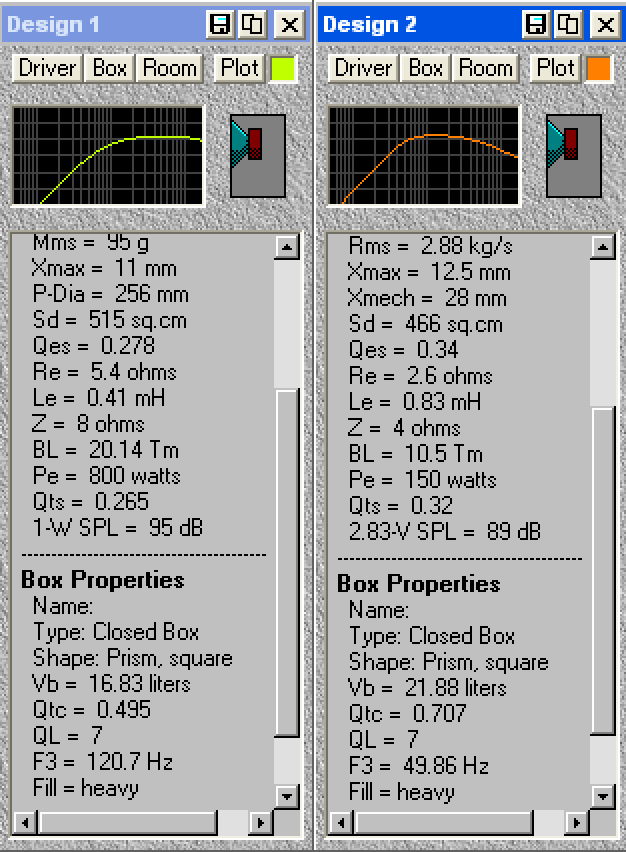
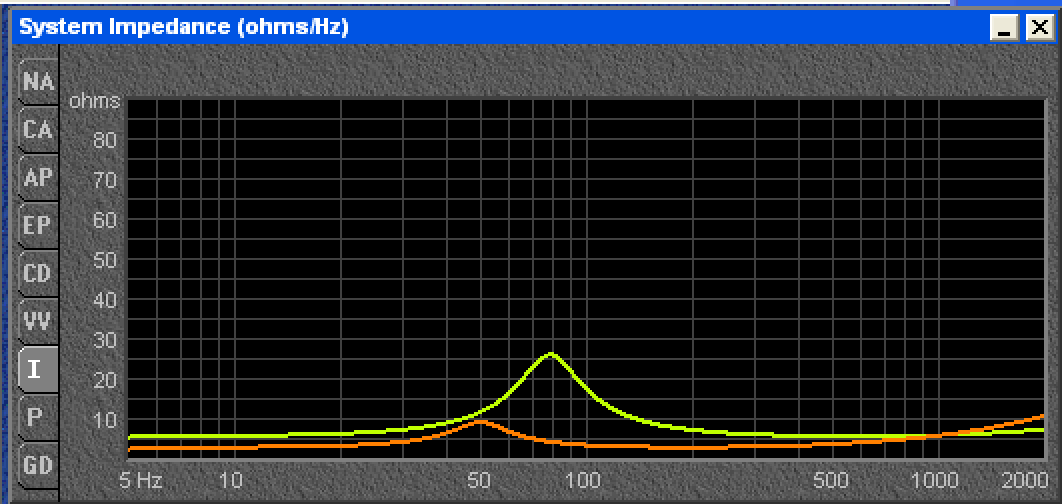
BMS could be a candidate for a conjugate network to take out the impedance bump.
BMS specs are optimised for vented enclosure so when it is sealed it wants a smaller box just under 17 litres.
The Scan is optimised for a closed box and wants just over 21 litres.
The BMS is much more efficient and is a pro driver that has a greater thermal limit at 800W, it will be harder to use the x-max of the Scan driver without running into thermal limits. Sims are run at 400W without x-max being reached but Pe is only 150W.
I would think they could be EQ'd to be very similar in Frequency response.
Thomann can source any of the BMS drivers and their shipping is very cheap at least it is to Australia!
I wanted to see what the difference between the BMS12S305 and Scan 30W would look like so I ran them through Bassboxpro as they are both in the library. BMS is green Scan is Orange.
BMS could be a candidate for a conjugate network to take out the impedance bump.
BMS specs are optimised for vented enclosure so when it is sealed it wants a smaller box just under 17 litres.
The Scan is optimised for a closed box and wants just over 21 litres.
The BMS is much more efficient and is a pro driver that has a greater thermal limit at 800W, it will be harder to use the x-max of the Scan driver without running into thermal limits. Sims are run at 400W without x-max being reached but Pe is only 150W.
I would think they could be EQ'd to be very similar in Frequency response.
Thomann can source any of the BMS drivers and their shipping is very cheap at least it is to Australia!
Attachments
I get pretty good slam, and that was my point really. In the bass, flat and smooth = good timing. Peaky response = sluggish bass. And of course, no bass = fast bass. Timing does not come into it. We have to remember that just because we can measure an improvement does not mean it is audible. Now, Wesayso claims he can hear it, but we need more evidence, yes?
I would be curious to see what the APL graph looks like 12 inches to either side. The room is so dominant in the low bass that the more you correct one position, the worse it becomes in other locations.
I'll try to work on improving my response and see if I can hear it. It would be cool if there really is an audible difference.
BTW, the APL software is not stable on my machine. Sometimes, I get identical results on consecutive sweeps, sometimes it is garbage. I don't know how much we should rely on it for accuracy.
I got the same instability when running trough the JRiver engine. I noticed a big improvement when I set "Play silence at startup for hardware synchronisation" to : "none"
Another thing I noticed in sweeps from my DAC alone is that the graphical EQ within JRiver's DSP could mess up my measurements. I spend some time with the DAC output wired to the soundcard's line in to optimise my Asio buffers and also ran it with full processing to check for errors.
Next time I get the mic out, I'll move to the sides. In a Stereo measurement it will obviously show a double peak at higher frequencies.
As said, my left and right output aren't perfect by themselves. Only in stereo does it line up perfectly, without running Stereo the left has trouble at 70 Hz, the right side makes up for that.
I hope you do try, especially between the 50 and 100 Hz mark. That should be noticeable. Effectively lining up the low end push and kick of the kick drum.
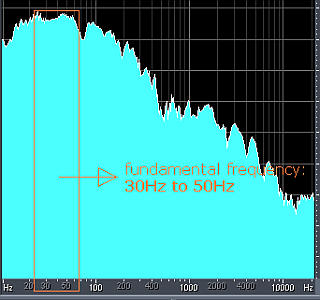
Drum Frequencies of Kick Bass Drum, Hi Hats, Snare and Crash Cymbals
Last edited:
I wanted to see what the difference between the BMS12S305 and Scan 30W would look like so I ran them through Bassboxpro as they are both in the library. BMS is green Scan is Orange.
BMS could be a candidate for a conjugate network to take out the impedance bump.
BMS specs are optimised for vented enclosure so when it is sealed it wants a smaller box just under 17 litres.
The Scan is optimised for a closed box and wants just over 21 litres.
The BMS is much more efficient and is a pro driver that has a greater thermal limit at 800W, it will be harder to use the x-max of the Scan driver without running into thermal limits. Sims are run at 400W without x-max being reached but Pe is only 150W.
I would think they could be EQ'd to be very similar in Frequency response.
Thomann can source any of the BMS drivers and their shipping is very cheap at least it is to Australia!
This is interesting
. You are very right to bring up the thermal limits of the 30W. That BMS sure would need a powerful amp! So does the 30W, but that one can't handle it for long. Easier at 4 Ohm to find that power cheap (but of good quality) though.Thanks for showing this. I need to look up aperiodic again to see what that could do for the impedance.
[shameless plug]
Let me make a shameless plug for that APL_TDA software. All the results I got were based on DRC-FIR and REW. It took me forever to find what I wanted to see. Countless nights were spend making sense of it all. After running APL_TDA I finally got to see what I wanted to see, the plots shown are my first runs with that Demo version. The reason I mention it as often as I do is because it makes for such a handy visual tool to see what I was "seeing" by going trough all of REW's plots. Though REW couldn't really show me this clearly like APL_TDA does.
As I said before, I did do a dance of joy, that first time I ran the APL software. It confirmed what I "thought" I was seeing in REW. I think I even surprised Raimonds.
Raimonds Skuruls gave the readers of Greg's convolution thread a very nice offer:
http://www.diyaudio.com/forums/full-range/275730-convolution-based-alternative-electrical-loudspeaker-correction-networks-27.html#post4583863
The reason for this shameless plug: I feel kind of guilty exploiting that piece of Demo software I've been promoting as I'm sure more people like it as a very handy tool. This generous offer makes it a no brainer in my book. Of course APL has it's own tools to straighten out the results as he has shown with a Demo within BYRTT's setup. I'm pretty sure APL_TDA EQ does a marvellous job. I've always wanted to test it separately but never got around to it. (I was too busy to get a new job/paid gig at that time)
So if you like what APL_TDA can do as a tool, visualizing what happens in your room, do contact Raimonds and take him up on that sweet offer.
[/shameless plug]
Sorry for that, I'd feel guilty if I don't.
Let me make a shameless plug for that APL_TDA software. All the results I got were based on DRC-FIR and REW. It took me forever to find what I wanted to see. Countless nights were spend making sense of it all. After running APL_TDA I finally got to see what I wanted to see, the plots shown are my first runs with that Demo version. The reason I mention it as often as I do is because it makes for such a handy visual tool to see what I was "seeing" by going trough all of REW's plots. Though REW couldn't really show me this clearly like APL_TDA does.
As I said before, I did do a dance of joy, that first time I ran the APL software. It confirmed what I "thought" I was seeing in REW. I think I even surprised Raimonds
.Raimonds Skuruls gave the readers of Greg's convolution thread a very nice offer:
http://www.diyaudio.com/forums/full-range/275730-convolution-based-alternative-electrical-loudspeaker-correction-networks-27.html#post4583863
The reason for this shameless plug: I feel kind of guilty exploiting that piece of Demo software I've been promoting as I'm sure more people like it as a very handy tool. This generous offer makes it a no brainer in my book. Of course APL has it's own tools to straighten out the results as he has shown with a Demo within BYRTT's setup. I'm pretty sure APL_TDA EQ does a marvellous job. I've always wanted to test it separately but never got around to it. (I was too busy to get a new job/paid gig at that time)
So if you like what APL_TDA can do as a tool, visualizing what happens in your room, do contact Raimonds and take him up on that sweet offer.
[/shameless plug]
Sorry for that
, I'd feel guilty if I don't.
Last edited:
This is interesting
Thanks for showing this. I need to look up aperiodic again to see what that could do for the impedance.


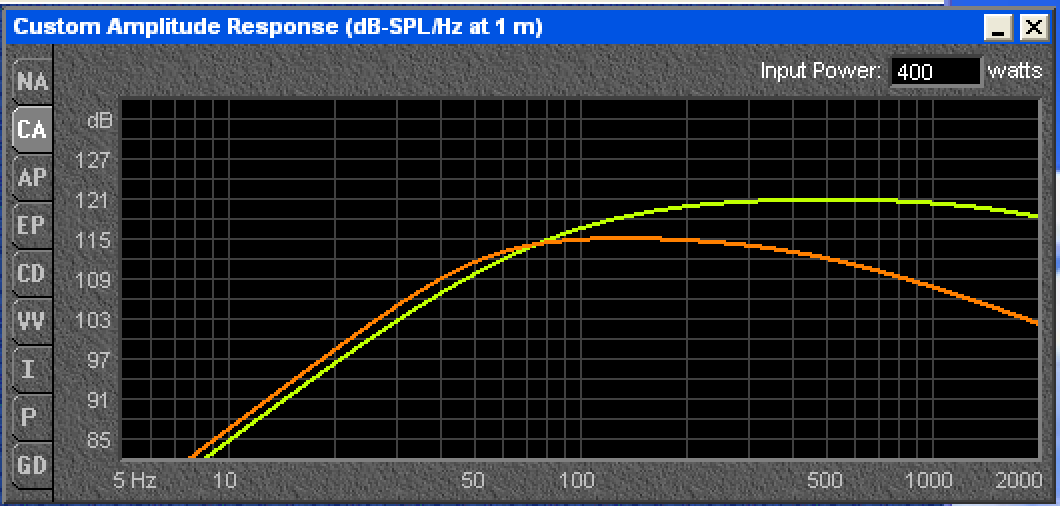
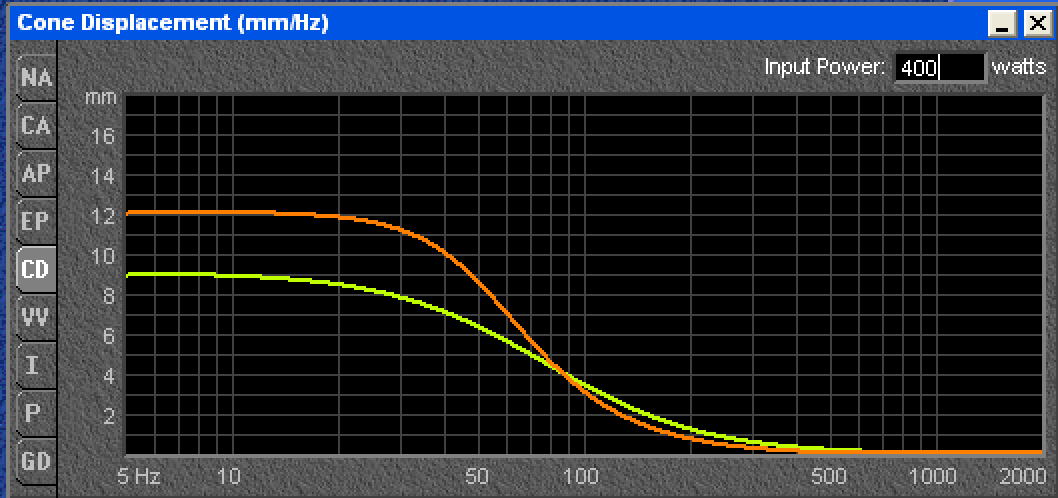
The AP Graph shows maximum output and below 40Hz they are almost identical, the BMS has much more headroom above 40 Hz as shown. The BMS will also use less cone travel to get there. You would get very similar output from either with the same power amp but the BMS can take a bigger amp if you have it or need more SPL. As soon as you use a linkwitz transform to boost the bass the maximum spl goes down, Jeff Bagby's woofer designer is good for simulating that.
The Hypex UCD amps are a good choice when you need lots of watts without the heat.
Dangerous question, would a Crown amp be any good for the low end? Either 2 light ones in bridged mode or one more powerful amp. Like 2x XLI800 or one XLI2500.
They are under the Harmon umbrella after all. I would need to find a good place to hide them, with possible fan noise being an issue. I did see HT guys use them often, as well as QSC and even Behringer.
Originally I was thinking Hypex DS 4.0 for the Scan/XXLS, the BMS (which I like) being 8 ohm I may want more power reserve, though I doubt I would need much more. It would be available with the Crown options. Those Hypex modules go up quickly if you want more power. They do have nice features (that I don't need).
The BMS simed is 8ohm... 4 ohm exist too, but it's here a special order, worth asking : http://en.toutlehautparleur.com/bms-12s305-4ohm.html
.....The Scan is optimised for a closed box and wants just over 21 litres.....
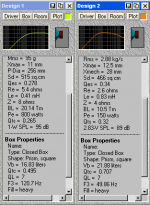
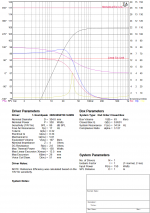
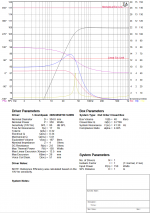
Hi fluid can you help me understand box size for 30W/4558T00 where you optimize at Qtc 0.707 / 21.88 liters / f3 49,86.
My software package is WinSpeakerz v 2.5.2 by John L. Murphy TrueAudio and asking for Qtc 0.707 means 50.76 liters / f3 37.56Hz, and have checked datasheet several times
 to see that T/S parameters is set correct into program.
1. below is Qtc 0.707 / 50.76 liters / f3 37.56Hz where it doesn't hit Xmax feeded 150W.
2. below is lowering Qtc to a point where at 150W input hitting Xmax, this gives lower bass extension and lower resonance point at Qtc 0.6501 / 63 liters / f3 34.54Hz.
3. below is because think Ronald said in past he have 40 liters available in those feet boxes and that gives Qtc 0.7789 / 40 liters / f3 41.38Hz, and with 150W full stroke can't be reached as with Qtc 0.707 config.
4. below is overlay of the three.
For info there is no baffle-step/diffraction loss in those models and because program ask for sensitivity (1W/1m) have decreased number from 89 to 86dB and hope this is correct or should it be decreased 6dB because we talk power here.
Attachments
Do you happen to have a comparison of REW (wavelet view I guess?) vs APL with the same, or at least v similar, measurement?[shameless plug]
Let me make a shameless plug for that APL_TDA software. All the results I got were based on DRC-FIR and REW. It took me forever to find what I wanted to see. Countless nights were spend making sense of it all. After running APL_TDA I finally got to see what I wanted to see, the plots shown are my first runs with that Demo version. The reason I mention it as often as I do is because it makes for such a handy visual tool to see what I was "seeing" by going trough all of REW's plots. Though REW couldn't really show me this clearly like APL_TDA does.
.
Yes I have, I've done the two back to back when I first tried the Demo version of APL_TDA;
Complete thread: http://www.diyaudio.com/forums/full-range/284916-room-correction-speaker-correction-what-can-we-do-dsp-power-now-availabl.html
A couple of things to note: the 3D and 2D plots in APL_TDA are normalised.
To see the frequency response you'd need to view the AFR plot, the DFR being APL's version of the group delay.
This graph is build up by slicing up everything with frequency dependent windows (to my knowledge). REW's plot is a lot more cumulative in comparison.
APL's plot looks more like a plot done in thin slices at the top end and thicker slices the further down in frequency you go.
Very informative to get a good view of the timing. Presented by hacking up the IR in slices with thickness depending on the frequency used.
The Demo can be run for free, that's what's used in the above quote.
So I decided to take the plunge. I was a bit scared at first. What if this software would prove my DSP processing to be wrong. Anyway, I decided I could learn a thing or two just by trying it.
I started as usual, outlining my microphone in REW, making sure my mic is in the sweetspot.
The resulting Wavelet graph in REW:

Next I moved on to the demo version of APL. Installed the required software, including the Matlab compiler and ran a few tests.
At fist I did get odd results at 96000. So I decided to try 48000. My difficulty was getting APL to run trough JRiver's processing. Not the fault of the APL software, just needed to find out how to get it to work. If you look at the uncorrected graph, I was seeing a lot of that. Until I found the right key to get it to run trough JRiver's correction.
Once I got there, confirming the audio route visually in JRiver I got these screen grabs:

And in 2D view:

Mr. Raimonds Skuruls, would you say this is a reasonable result, now viewed in higher resolution?
I did already say I recognised much of my own priorities in your paper. A way of looking at this audio problem, actually. I enjoyed reading the discussion you had with Toole. I recognised a lot of it in my own rationale, where I differed from Toole's opinion. At least what he did make public in his paper.
I just used different software to get this, the stuff I had available to get me there. To me it does look like it works either way. As it should!
Even the listening impressions you quoted from a client(*) did sound very familiar
To show what my result is without my FIR correction:

I keep claiming on this forum this stuff really works, I hope more people do try it.
(*) = on the Prosound website
Fun Demo! Thanks for the opportunity. Basically it seems we agree on a lot of grounds. At least I like to think that. It took me the bigger part of this year to get this. Using a lot of my time to find what works and what doesn't. Spitting trough all graphs in REW to find my answers and using DRC-FIR outside of it's intended scope. The better the measurements became, the more pleasing sound I got. With all genre's I listened to.
No brute force correction that only works at a single position. I'm using short frequency dependent windows (as short as I could get away with) to do the correction.
Disclaimer: All measurements were made in a "live" living room at the listening position. What I show here is a Stereo measurement of my corrected line arrays in my room. Corrected with REW, DRC-FIR and JRiver and a lot of work!
Complete thread: http://www.diyaudio.com/forums/full-range/284916-room-correction-speaker-correction-what-can-we-do-dsp-power-now-availabl.html
A couple of things to note: the 3D and 2D plots in APL_TDA are normalised.
To see the frequency response you'd need to view the AFR plot, the DFR being APL's version of the group delay.
This graph is build up by slicing up everything with frequency dependent windows (to my knowledge). REW's plot is a lot more cumulative in comparison.
APL's plot looks more like a plot done in thin slices at the top end and thicker slices the further down in frequency you go.
Very informative to get a good view of the timing. Presented by hacking up the IR in slices with thickness depending on the frequency used.
The Demo can be run for free, that's what's used in the above quote.
Last edited:
One more noteworthy thing: APL_TDA EQ is based on multiple measurements, so not like the single position I use in DRC_FIR.
These multiple measurements would bring the overall room contribution down. Similar to what has been discussed here: http://www.diyaudio.com/forums/multi-way/221434-rephase-loudspeaker-phase-linearization-eq-fir-filtering-tool-141.html#post4920173
Phase correction is not standard but can be done (I believe Phase correction is based on a single point of the multipoint measurement, not sure though)
An interesting piece of software, no doubt.
APL_TDA EQ is a separate program and can provide correction.
APL_TDA is a measurement suite, no correction.
More info on: Acoustic Power Lab :: Home
Last edited:
As far as my knowledge goes the phase correction is a separate step. I've seen it done/demonstrated in the papers and Raimonds did a demo with BYRTT where he corrected phase and supplied EQ based on multiple measurements from BYRTT.
I've only used APL_TDA, the measurement suite without correction build in. I got an Academic license from Raimonds right after my trial run on the above thread. I still do everything my old fashion way with REW and DRC-FIR (hard to let go of what you've learned) but do consider the APL_TDA suite a useful additional tool to verify. I've also used it for timing references when I was setting up my ambient channels. So much easier to "see" what's going on.
APL has its own hardware available able to run the FIR correction and also has it's own convolution plugin that can run on a PC.
Without the phase correction (just using the EQ part) you basically get a perfect speaker with crossover time delay showing in the graphs.
Last edited:

Yes, but you can change its position I believe.
It has been compared to Acourate's s-transform in the thread I linked to. APL shows the peak output as a clear timing reference, and you get to see both sides, the wave building up (including possible pré ringing) and the decline of the wave front at the mic position after that. Generally a view of what that first wave front looks like that hits our ears.
I've never played with Acourate, couldn't afford it at the time.
The fact that the graph is based on time slices dependent in length of the actual frequency makes it way easier to read. The one thing I would have liked to see is an option to see it without normalisation applied.
As is, it's primary goal is to provide a visual guide to see the timing.
I didn't "need" it, as said I haven't used it to get where I'm at. I do think it provides a clear view into a subject I feel has relevance.
Compare it to my DAC output run trough APL_TDA, an actual measurement of my playback chain.
This could be considered the ideal curve as it shows what theoretical pure time alignment looks like:
You can also compare it to this one, a perfect impulse as generated by RePhase a minute ago.
I just imported that into APL_TDA using the import (imp IR) function.

Also showing the ability to view from different angles:

If you like what you see, try it! The Demo is pretty functional as is. You can't save measurements but you still get the visual.
It seems it does have a time limitation though. At least when I tried my original Demo install it mentioned as much.
New things do get added according to recent posts on Facebook.
I just imported that into APL_TDA using the import (imp IR) function.
Also showing the ability to view from different angles:
If you like what you see, try it! The Demo is pretty functional as is. You can't save measurements but you still get the visual.
It seems it does have a time limitation though. At least when I tried my original Demo install it mentioned as much.
New things do get added according to recent posts on Facebook.
Last edited:
Thanks Brytt for the comparisons and for showing the effect of a 48 db/oct crossover at 80 Hz. I'm not sure if the slope is LR or BW, JRiver don't allow you an option to specify the slope type. But it's clear what's causing the warp around 80 Hz.
Wesayso, thanks for the note about JRiver. Hopefully, that will fix the stability issue. It provides an especially clear view of what is happening. I compared it to REW's spectogram and the results are similar but APL is much easier to read.
I wish I had more controls though, maybe the final version does.
Today has been a gigantic waste. We got dumped with a foot of snow. I hate shoveling snow!
Attachments
- Home
- Loudspeakers
- Full Range
- The making of: The Two Towers (a 25 driver Full Range line array)