Periodic noise has another advantage : the crest factor is known and can be much lower (eg 6dB) than random pink noise.
But when I use MMM method, I use the same random noise for the measurement itself and for the listenings, eg comparring left and right speaker.
And the periodic noises I've tried, sound with a kind of rythm and structure that disturbs me.
But when I use MMM method, I use the same random noise for the measurement itself and for the listenings, eg comparring left and right speaker.
And the periodic noises I've tried, sound with a kind of rythm and structure that disturbs me.
I tried to check the relation between measuring distance, number of independant measuring points, resulting standard deviation and perception, to evaluate what is the needed scanning distance :
The perception curve is an approximation but we see that a 10m scanning should give a measured frequency response precise enough for equalisation (this has to be confirmed).
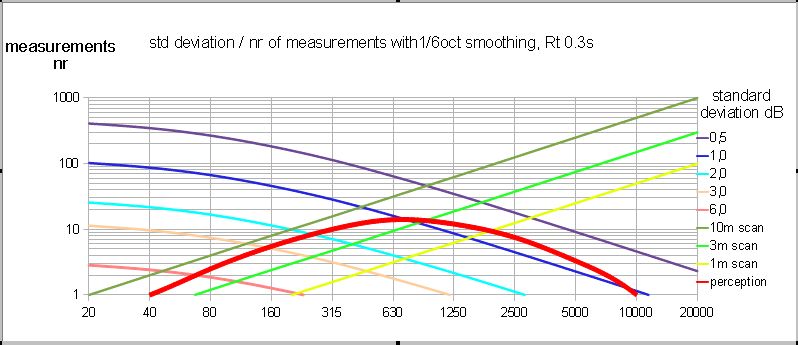
- The relation between measuring distance and number of independant measuring points comes from Hopkins.
- The standard deviation is calculated from number of points based on equation σ = 11.14/(√(1+2.38*B*Tr)*√N), from Schroeder and Hopkins
- The approximate frequency dependant threshold of perception is an estimation based on Moore and Toole and some personnal ABX listening tests. This curve should correspond to the threshold of audibility of 1/6th octave bandwidth deviations on a signal, with pink noise supposed to be the most revealing signal.
The perception curve is an approximation but we see that a 10m scanning should give a measured frequency response precise enough for equalisation (this has to be confirmed).
You seem to start from an assumption that everyone is an idiot and if something doesn't look right to you, it's wrong, which is probably why exchanges with you quickly become fractious.
John - I think that you are the one being testy here, as if being questioned is annoying to you. I politely asked you to explain your comment on windowing of random noise and I get back an explanation of how periodic noise works (as if I didn't know.) The question was never about periodic noise.
Last edited:
jlo
I do not understand your curves or what they mean.
"nr" is?
Why does "number of independent measuring points" depend on the measuring distance? Do you mean the distance from the source or the distance of the sweep? The number of independent points would depend on the distance covered by the sweep, but not the distance from the source.
Is the point here to find the minimum measurement circle radius for a sufficiently stable 1/6 oct. measurement to fall below the threshold of audibility? Shouldn't you use Critical bands in that case, not a constant 1/6 octave?
nr is the number of independant measuring points covered the scan distance, which is the length of the mic movement during the measurement
Yes the point was to find the minimum scanning distance to have a valid and stable response. You're right, I could also use ERB instead of constant 1/6th octave.
Yes the point was to find the minimum scanning distance to have a valid and stable response. You're right, I could also use ERB instead of constant 1/6th octave.
jlo
OK, I understand the goal, but I am still not clear on what all the curves mean. I just can't seem to figure out what you are showing. A little more explanation would help.
The dark red line would tend to be flatter at the higher frequencies if you used ERB. It would also dive faster at the lower frequencies right? Hence it would be something like a HP filter at about 700 Hz. Which would be a very interesting result if that is the case.
The problem is that I don't have a curve similar to this with ERB smoothing :The dark red line would tend to be flatter at the higher frequencies if you used ERB. It would also dive faster at the lower frequencies right? Hence it would be something like a HP filter at about 700 Hz. Which would be a very interesting result if that is the case.
It is figure 2 from Dave Clark, see here : Some Experiments With Time
I think my perception curve would be flatter in higher frequencies but also a bit flatter in lower frequencies because the ERB bandwidth being wider, the minimal audible deviation should be lower at both extreme frequencies.
Anyway, I think that the indicated perception curve is too high in my diagram : I calculated with a variation being half of peak to dip, which is not the standard way. I should present it with same values as Dave Clark above. Knowing that coloration is nearly proportional to the surface of the band deviation, I should be able to approximatively recalculate the curve for ERB smoothing.
Sorry for not being so clear, and give me some time to think about it....
Last edited:
I wish there was a better set of data than a 30 year old test on one person, but I guess its a start.
Prof. Farina did a study of the perceived quality of different EQ schemes using partial octave and ERB smoothed curves for the EQ. His tests showed the ERB to be the preferred method. Based on this I started using ERB smoothing in my work.
If we take Dave's data as valid (since we don't have anything else) then the ERB would be above the 1/3 octave above 1-2 kHz and about the same as the 1/3 octave below that. The next time I see Dave (which is almost weekly, his wife is my son's god mother) I will ask him this data was taken and if he knows of anything that supersedes it.
Not to add to the confusion, but what does "Knowing that coloration is nearly proportional to the surface of the band deviation".
I applaud your attempts here at quantifying what level of frequency response deviation is audible. I have longed wished that I had such a curve, but as I said Dr. Farina's work was, to me, the most convincing in this regard.
We know that when you depart from frequency response flatness, adding some equalisation (call it coloration here), the coloration perception is not related only to the gain but also to the bandwidth of the eq : Clark, Toole, aso... showed that a +2dB with a low Q (large bandwidth) was more noticeable than, let's say a +6dB with a high Q (shallow bandwidth).Not to add to the confusion, but what does "Knowing that coloration is nearly proportional to the surface of the band deviation".
When I look at Clark and Toole's figures, read Moore and Zwicker, the coloration seems to be approximatively related to the value of gain x bandwidth (or gain/Q), that's what I call the "surface" of the deviation from flatness.
A more precise model would be the one of S.Olive in "A Multiple Regression Model for Predicting Loudspeaker Preference Using Objective Measurements: Part II" with the calculated statistics of narrow band deviation (NBD) and smoothness (SM).
Angelo Farina wrote so many nice papers ! Could you tell us the reference of the one you're talking about, I would be interested to read it.Prof. Farina did a study of the perceived quality of different EQ schemes using partial octave and ERB smoothed curves for the EQ
Last edited:
Hi jlo
I'm following the discussion with great interest as I'm using this manual technique quite a lot. There are three issues though I haven't come to a conclusion yet.
First, both direct and indirect sound contribute to timbre. Depending on room acoustics and speaker radiation the D/R ratio changes rather significantly between installations. How to account for this with a steady-state measurement?
Second, at lower frequencies high Q resonances have a very detrimental perceptual effect. Spatial averaging seems to hide information which would be required for good equalization.
Third, minimum phase equalization happens early in time. If different equalization curves are applied to L and R there might be detrimental effects on localization of phantom sources.
We know that when you depart from frequency response flatness, adding some equalisation (call it coloration here), the coloration perception is not related only to the gain but also to the bandwidth of the eq : Clark, Toole, aso... showed that a +2dB with a low Q (large bandwidth) was more noticeable than, let's say a +6dB with a high Q (shallow bandwidth).
When I look at Clark and Toole's figures, read Moore and Zwicker, the coloration seems to be approximatively related to the value of gain x bandwidth (or gain/Q), that's what I call the "surface" of the deviation from flatness.
A more precise model would be the one of S.Olive in "A Multiple Regression Model for Predicting Loudspeaker Preference Using Objective Measurements: Part II" with the calculated statistics of narrow band deviation (NBD) and smoothness (SM).
Angelo Farina wrote so many nice papers ! Could you tell us the reference of the one you're talking about, I would be interested to read it.
If I had the exact Farina reference I would give it to you, but I don't. It had something to do with equalizing cars, probably done for Fiat as he had a lot of contracts with them. I am pretty sure that it was an AES paper (but not a publication), more than ten years ago.
I would phase your "coloration perception" this way, which is, I believe, the same way that Tolle describes it; The perception is proportional to the area under the curve (the absolute deviation from "normal".)
I would caution however that Griesinger takes strong exception to those results and I find them somewhat questionable myself. They are probably generally true, but I think that there are specific examples, some pointed out by Toole himself, where this does not really hold. For example, peaks and dips are not the same even though they have the same "area under the curve". And all frequencies are not the same either.
As I said, I applaud your attempts at finding the relationships that you are looking for, but it won't be easy. There always seems to be the case that breaks the generic rule.
Hi jlo,...
Third, minimum phase equalization happens early in time. If different equalization curves are applied to L and R there might be detrimental effects on localization of phantom sources.
This is getting difficult... Acoustic transfer function is what we hear and measure here. I am not comtetent to say how L/R spesific eq will ruin or correct amplitude response and phase.
We have lots of evidence that moderate phase (group) delay can not be heard, but how does it's L/R difference influence stereo imaging. Perhaps we a just digging too deep here? Go buy headphones!
Yes, truly engaging high-level discussion of measurement tactics. But there remains the question, "measurement for what?"Hi jlo
I'm following the discussion with great interest as I'm using this manual technique quite a lot. There are three issues though I haven't come to a conclusion yet.
First, both direct and indirect sound contribute to timbre. Depending on room acoustics and speaker radiation the D/R ratio changes rather significantly between installations. How to account for this with a steady-state measurement?
Second, at lower frequencies high Q resonances have a very detrimental perceptual effect. Spatial averaging seems to hide information which would be required for good equalization.
Third, minimum phase equalization happens early in time. If different equalization curves are applied to L and R there might be detrimental effects on localization of phantom sources.
We are trying to document as separately as possible the characteristics of direct sound and room-added sound. The discussion has to move on to address the sort of issues associated with Toole's and Griesinger's names.
I think we all take for granted that direct sound should be flat or at least house-curved in a basic way. How that is achieved is a matter of techy sonic allegiances.
But what are the best characteristics for the other sound that gets to us? I am not supposing there's any shortage of opinions. But I would like to see that question now opened, perhaps in a new thread.
Moment of self-promotion relevant to this thread: if you search for "Giotto" in post #27 in the link below, you'll find my take on perceptual cues and how the discovery of perspective in Renaissance painting relates to recording engineering. Dead-end to talk about physical impingements when the perceptual language that moves the discussion forward is in terms of human "cues."
http://www.diyaudio.com/forums/lounge/263024-how-important-stereo-image-2.html#post4081814
Ben
Last edited:
We are trying to document as separately as possible the characteristics of direct sound and room-added sound. The discussion has to move on to address the sort of issues associated with Toole's and Griesinger's names.
I think we all take for granted that direct sound should be flat or at least house-curved in a basic way. How that is achieved is a matter of techy sonic allegiances.
Ben
HI Ben
In this thread we are not really trying to separate the direct from the reverb fields, I raised this issue before. This technique applies only to the reverberant field.
I don't think that measuring the direct sound "is a matter of techy sonic allegiances". The direct sound is the free field measurement, period. One can add in a factor to consider the very early reflections as Toole and Olive do at JBL, but they also show just the direct sound in their data. Keep in mind however that the direct sound is not necessarily the axial response. Many of us listen off axis.
Perception, as in any art, be it painting or music, is very difficult to track and *****. That is why I prefer to get to as much objectivity in the discussion as possible because subjectivity is not very stable.
The MMM method is keeping mainly direct field and removing most of the indirect sound, especially in mid and high frequencies. This is fine because most (but not all...) of the perceived timbre comes from direct field. A way to vary the part of the room response in the measurement would certainly be interesting but complicated : the arrival time has to be considered.First, both direct and indirect sound contribute to timbre. Depending on room acoustics and speaker radiation the D/R ratio changes rather significantly between installations. How to account for this with a steady-state measurement?
Personnaly, when I measure in a room where the main listening positions are defined (not a cinema), I tend not to measure over too big a volume to avoid this low frequency averaging. This is exactly a problem I had once with Dirac correction : averaging over a too large surface removed too much of the modal response, then modes where not well corrected at main seats.Second, at lower frequencies high Q resonances have a very detrimental perceptual effect. Spatial averaging seems to hide information which would be required for good equalization.
Keeping mainly the direct response with MMM method, the corrections are generally very similar between left and right. So the localization is not damaged, in fact it is often improved because you tend to better align L to R.Third, minimum phase equalization happens early in time. If different equalization curves are applied to L and R there might be detrimental effects on localization of phantom sources.
If I had the exact Farina reference I would give it to you, but I don't. It had something to do with equalizing cars, probably done for Fiat as he had a lot of contracts with them. I am pretty sure that it was an AES paper (but not a publication), more than ten years ago.
I would phase your "coloration perception" this way, which is, I believe, the same way that Tolle describes it; The perception is proportional to the area under the curve (the absolute deviation from "normal".)
I would caution however that Griesinger takes strong exception to those results and I find them somewhat questionable myself. They are probably generally true, but I think that there are specific examples, some pointed out by Toole himself, where this does not really hold. For example, peaks and dips are not the same even though they have the same "area under the curve". And all frequencies are not the same either.
As I said, I applaud your attempts at finding the relationships that you are looking for, but it won't be easy. There always seems to be the case that breaks the generic rule.
I think you mean this paper:
AES E-Library Digital Equalization of Automotive Sound Systems Employing Spectral Smoothed FIR Filters
ERB or critical band smoothing have the same "liking", but standard deviation was smaller on ERB...
That is what I've found so far. Limited sample number, tho, for sure.So the localization is not damaged, in fact it is often improved because you tend to better align L to R.
I think you mean this paper: AES E-Library Digital Equalization of Automotive Sound Systems Employing Spectral Smoothed FIR Filters
Thanks a lot, and for those not members of the AES, it is also here :
http://pcfarina.eng.unipr.it/Public/Papers/245-AES125.pdf
Last edited:
Yes, truly engaging high-level discussion of measurement tactics. But there remains the question, "measurement for what?"
We are trying to document as separately as possible the characteristics of direct sound and room-added sound. The discussion has to move on to address the sort of issues associated with Toole's and Griesinger's names.
I think we all take for granted that direct sound should be flat or at least house-curved in a basic way. How that is achieved is a matter of techy sonic allegiances.
But what are the best characteristics for the other sound that gets to us? I am not supposing there's any shortage of opinions. But I would like to see that question now opened, perhaps in a new thread.
Moment of self-promotion relevant to this thread: if you search for "Giotto" in post #27 in the link below, you'll find my take on perceptual cues and how the discovery of perspective in Renaissance painting relates to recording engineering. Dead-end to talk about physical impingements when the perceptual language that moves the discussion forward is in terms of human "cues."
http://www.diyaudio.com/forums/lounge/263024-how-important-stereo-image-2.html#post4081814
Ben
I'd say you are mistaken in each of the things you say.HI Ben
In this thread we are not really trying to separate the direct from the reverb fields, I raised this issue before. This technique applies only to the reverberant field.
I don't think that measuring the direct sound "is a matter of techy sonic allegiances". The direct sound is the free field measurement, period. One can add in a factor to consider the very early reflections as Toole and Olive do at JBL, but they also show just the direct sound in their data. Keep in mind however that the direct sound is not necessarily the axial response. Many of us listen off axis.
Perception, as in any art, be it painting or music, is very difficult to track and *****. That is why I prefer to get to as much objectivity in the discussion as possible because subjectivity is not very stable.
First paragraph, jlo in the post after yours says the opposite of what you say and he ought to know what this thread is about. Anybody can stick a mic in the air and measure something: we are looking for discriminations in that stream of sound, with the principal discrimination being between direct and room-added sound.
Second, all the sound that hits the mic directly from the speaker is direct sound. Some people make speakers with dispersion chosen by some horn theory or principle. Some people have speakers (like ESLs) where dispersion is handled as a secondary consequence of other decisions. Both tech approaches send sound directly to the mic.
Third, wouldn't matter if we could measure sound to five decimal places and also parse direct from other sound if we were clueless about what the purposes of measurement were. These purposes have human perception at the core, whether you think that's too touchy-feely or not. Kind of biases the issue to refer to perception as an art. It is obviously essential to understand hearing perception in order to tweak the physics to achieve the desired results. Measurements of perception are plenty stable when the research is conducted by qualified psychologists; but it can be truly lousy and unhelpful when conducted by people trained in other sciences or even as engineers.
Ben
Yes, truly engaging high-level discussion of measurement tactics. But there remains the question, "measurement for what?"
We are trying to document as separately as possible the characteristics of direct sound and room-added sound. The discussion has to move on to address the sort of issues associated with Toole's and Griesinger's names.
I think we all take for granted that direct sound should be flat or at least house-curved in a basic way. How that is achieved is a matter of techy sonic allegiances.
But what are the best characteristics for the other sound that gets to us? I am not supposing there's any shortage of opinions. But I would like to see that question now opened, perhaps in a new thread.
Ben
I was just at the AES and heard the long tutorial by Floyd Toole. What was interesting was that he had added some recent measurements of a speaker EQed in several different ways.
Floyd has been (in my opinion) off on a tangent in the last few years with a concentration of in-room curves. His early studies showed that flat smooth axial response was strongly preferred while any downsloping and generally smooth power response was okay.
Looking at room curves gives a bit too much credance to total power response. We tend to listen at the critical distance or a little farther (okay, within the critical distance for high frequencies) and so a room curve will be a near equal blend of direct and reflected sound.
To the Toole measurements, they had taken an average to good system that could benefit from some EQ. The axial response wasn't quite flat and the directivity index was typical but not ideal. With such a system, you EQ the axial response, say by starting in an anechoic chamber, then the radiated power would have a good down hill trend but would not be totally smooth.
Alternatively, you could exactly equalize power response to that smoothed down hill trend and achieve an ideal sloping power response with a fair+ axial response. In both cases the broad trends of axial and power response would be similar. The difference would be which of the two you were concentrating on with your EQ, which you were making most smooth.
So he had 3 cases for his usual blind testing regimen: no EQ at all, EQ for best anechoic or axial response, and EQ for ideal power response with approx. flat axial response.
The panel scoring was (these numbers are my approximate recollection) 4.8 for the unequalized system, 6.2 when it was equalized for best power response, and 6.6 equalized for flattest axial response. By a small but significant amount EQ with regard to axial response was best.
An in-room curve will always lead you to EQing the power response to some degree. Often this is not fatal because the directivity index curve is fairly smooth and typically falling down hill with the appropriate rate (not, strictly speaking, constant directivity). EQing the anechoic response to flat or the axial/power response blend to a typical room curve won't be miles apart. The problem comes in when you have a system with strongly atypical directivity.
Thats how I see it.
David
- Home
- Loudspeakers
- Multi-Way
- Moving Mic Measurement