And just as in the first sims, hovering over circuit lines and nodes shows the DC conditions. We will elaborate on that and actually "click and attach" voltages to the diagram.
I keep getting question marks instead of voltage values. Any idea what I'm doing wrong?
And just as in the first sims, hovering over circuit lines and nodes shows the DC conditions. We will elaborate on that and actually "click and attach" voltages to the diagram.
I keep getting question marks instead of voltage values. Any idea what I'm doing wrong?
The question marks should change to the voltages when you run the simulation again. When you close and reopen the file, all the data is lost.
Make sure you have the DC op pnt selected initially and then run the simulation.
Does that work 🙂
The question marks should change to the voltages when you run the simulation again. When you close and reopen the file, all the data is lost.
Make sure you have the DC op pnt selected initially and then run the simulation.
Does that work 🙂
No it doesn't. They remain question marks.
Hmmm... well go through it from the start.
I'll have to just break off for a little while first though. Back later 🙂
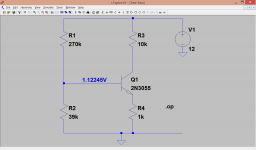
Try this though... attached is a basic file for the amp. Run it (close the first window of text that appears) and then left click say the collector twice and attach a voltage to the trace.
If that's OK then close the file completely, reopen it (it should show a question mark) and then run it (should revert to the voltage again)
I'll have to just break off for a little while first though. Back later 🙂
Try this though... attached is a basic file for the amp. Run it (close the first window of text that appears) and then left click say the collector twice and attach a voltage to the trace.
If that's OK then close the file completely, reopen it (it should show a question mark) and then run it (should revert to the voltage again)
Attachments
Hmmm... well go through it from the start.
I'll have to just break off for a little while first though. Back later 🙂
Try this though... attached is a basic file for the amp. Run it (close the first window of text that appears) and then left click say the collector twice and attach a voltage to the trace.
If that's OK then close the file completely, reopen it (it should show a question mark) and then run it (should revert to the voltage again)
It doesn't show a voltage when I initially click on it or any time after. Just three question marks. Even right beside the 12 volt source shows question marks.
Last edited:
OK, I'll just talk you through what I am doing... you do exactly the same.
Attached to this post is another LT file devoid of all the commands. Its called Test Two.
1/ Download and open it.
2/ Right click the workspace and select <Edit Simulation>
3/ Select the DC op pnt tab and click OK. That lets you drop the .op command onto the diagram.
4/ Right click the workspace and select <run>
5/ Close the new window that opens.
6/ Move the cursor over the horizontal trace wire that goes to the base of the transistor.
7/ Left click it slowly twice and you should be able to attach a voltage.
Do you get that far ?
Attachments
I've figured out what I'm doing wrong. My mouse is set too fast. By the time I get the second click I've moved off the wire slightly. Thanks.
Last edited:
Excellent. A speedy mouse 🙂
(these are all useful things to know actually because if its done it for you it will do it for others too)
(these are all useful things to know actually because if its done it for you it will do it for others too)
Adding ripple to the PSU.
Something different...
We all know clean and stable rails are important but can we simulate the effect of less than perfect supplies in LT. Well up to a point we can.
Lets go back to the basic sim and set it to run the <transient> simulation. Now right click the supply voltage source and set it like this.

Now run the simulation and probe first of all the supply line. We have ripple... and lots of it. Can you also see how the waveform was made up from the settings you just entered ?
Now probe the amplifier output. I think we can safely say that the buzz would be a trifle audible.

Now change the sim to show an FFT. You should have learned enough to be able to do that... remember to account for the time constant of the caps. Hint... change the caps to say 800,000uf and clear the "number of cycles" box from the voltage source. If you cut the input voltage source (scissors, cut the trace leading to the input) from the circuit and now run the transient sim for say 10 seconds you should see this appearing on the amplifier output.

Now rerun the FFT but this time change the sample points to a lower number. The lower harmonics are shown more clearly.

And we see this in all its glory.

If you look closely at the FFT and move the cursor over it you will see the harmonics coincide with the 50Hz mains (so we get 100Hz ripple with a full wave bridge and reservoir cap). Its not good is it ?
You can also put voltage sources in series. Bob C gives an excellent example in his book whereby an amplifier is simulated for the 19+20kHz CCIF test using two input sources in series.
Something different...
We all know clean and stable rails are important but can we simulate the effect of less than perfect supplies in LT. Well up to a point we can.
Lets go back to the basic sim and set it to run the <transient> simulation. Now right click the supply voltage source and set it like this.
Now run the simulation and probe first of all the supply line. We have ripple... and lots of it. Can you also see how the waveform was made up from the settings you just entered ?
Now probe the amplifier output. I think we can safely say that the buzz would be a trifle audible.
Now change the sim to show an FFT. You should have learned enough to be able to do that... remember to account for the time constant of the caps. Hint... change the caps to say 800,000uf and clear the "number of cycles" box from the voltage source. If you cut the input voltage source (scissors, cut the trace leading to the input) from the circuit and now run the transient sim for say 10 seconds you should see this appearing on the amplifier output.
Now rerun the FFT but this time change the sample points to a lower number. The lower harmonics are shown more clearly.
And we see this in all its glory.
If you look closely at the FFT and move the cursor over it you will see the harmonics coincide with the 50Hz mains (so we get 100Hz ripple with a full wave bridge and reservoir cap). Its not good is it ?
You can also put voltage sources in series. Bob C gives an excellent example in his book whereby an amplifier is simulated for the 19+20kHz CCIF test using two input sources in series.
Good going Mooly.
I am sure there are many of us reading along even if we do not post.
Awesome work!
I am sure there are many of us reading along even if we do not post.
Awesome work!
Window ...
Yes... they needed a clean 😉
Pavel is suggesting a more suitable setting for the FFT.

Which allows a much better result. Thanks 🙂

And I can't resist adding this one 😱

Good going Mooly.
I am sure there are many of us reading along even if we do not post.
Awesome work!
Thanks myhrrhleine... I'm learning as I go along too.
This is outstanding! Thank you! Any chance you might add an installment on adding tube models to spice?
Thanks again!
Thanks again!
Just to make the point that extremely realistic power supplies, attached to the nominal circuit being examined, can be simulated in LTspice - a power supply is still an electrical circuit, all the parts exist in LTspice to make it happen; what happens is that you discard the ideal supplies normally used, and extend the circuit, modelling real world supply components.We all know clean and stable rails are important but can we simulate the effect of less than perfect supplies in LT. Well up to a point we can.
This is outstanding! Thank you! Any chance you might add an installment on adding tube models to spice?
Thanks again!
Pleased you are finding it useful. Tooobs... no promises (and I don't do tooobs 😀) but I'll have a look into it.
Just to make the point that extremely realistic power supplies, attached to the nominal circuit being examined, can be simulated in LTspice - a power supply is still an electrical circuit, all the parts exist in LTspice to make it happen; what happens is that you discard the ideal supplies normally used, and extend the circuit, modelling real world supply components.
I would say up to a point because even with the best will in the world, you will never come close to simulating a complete build, its wiring, the PCB, component parasitics etc. On a more basic level though, you can.
I had in mind to do a little more on PSU's but more...... well you'll see 🙂
Simulating a simple PSU.
Lets now us LT to do something a little different. We will attempt to design a simple PSU and use LT to look at the voltages and ripple produced. We will build on that and later add a voltage doubler and a simple regulator.
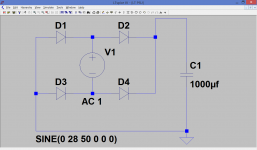
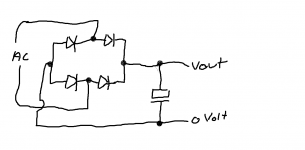
Firstly we need some idea of the actual circuitry we will use. A typical idea might start off like this...

We need to translate that into a simultion so we begin by opening LT and creating a "new schematic" which you can then save under a new file name in your chosen location.
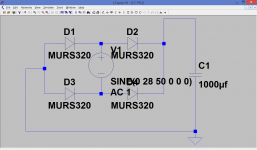
To build the circuit we need four diodes and a cap to begin. Click the "diode" symbol on the top line and drop four diodes onto the workspace. Before you make the drop, carry the attached symbol over to the "rotate" symbol (4th in from the right) and orientate them so that the circuit can be drawn out logically. Having dropped four diodes, do a right click to deselect the diode drop and now using the same method drop a cap onto the workspace.

Now wire it up neatly.

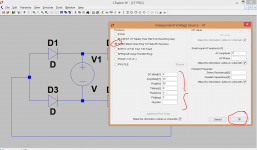
Our voltage source will be sinewave, just as if transformer fed. So we need to add a voltage source to the diode bridge input. Using the "component" symbol on the top line, open the component library and select a "voltage" source and add it to the diagram. Let us assume we have a 20 volt transformer. That 20 volts is an RMS value and LT needs a peak value to set the source up. So we multiply 20 by root 2 to arrive at 28 volts. We enter that value by right clicking the voltage source and selecting "advanced". We can also enter the other details at this point too.

What might be a good reservoir cap value. Lets use a modest 1000uf. Right click the cap and make the value 1000uf. We also must add a ground symbol to the diagram, so do that now attaching it to the 0 volt line. We also need a suitable diode. Right click each in turn and using the "pick new diode" option select the MURS320. That is a typical silicon diode. At this point we also tidy things up by using the "hand" symbol.
Information... if you right click the diodes text, that is to say the MRS320 text you get a window with options of how to palce the text, or to make it invisible if space is short.
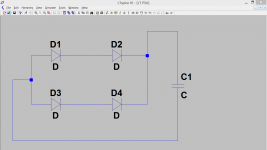
So we can go from this,

To this.

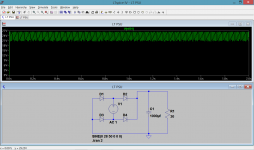
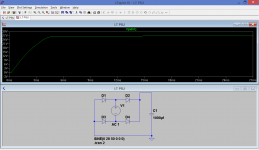
To simulate the circuit we will initially run the sim for 2 seconds, so open the <edit simulation> option (right click the workspace) and set 2s as the transient stop time.
Now run the simulation and probe the voltage on the cap. You should see a nice steady 27 volts or so (LT has correctly accounted for the diode volt drop of the bridge). Do you remember how we could expand any section of the trace by putting the cursor over the section of interest and drawing a box around the part to expanded ?
Look closely at the start of the trace. The charging of the reservoir cap is shown correctly and if you look at just that portion of the waveform you should see something like this.

Why have we no ripple on the output ? It is because we are drawing no current so what we can do now is add a load resistor of say 30 ohms.
That will draw just under 1 amp. You should know how to attach that by now so go ahead and add the part and re-run the simulation.
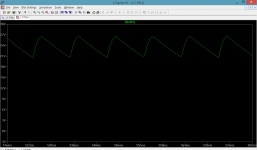
Now we have lots of ripple.

Expand the trace and look at the detail.

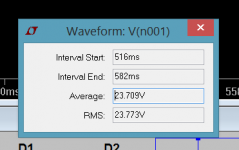
If you hold CTRL and left clcik the trace label then just as before, we can see the voltages.

That is probably enough to be going on with for the moment... next we will add the doubler and regulator. Did you notice that we didn't run the DC op pnt command on this one. You can try it but you will find the voltages are all zero. That is because there is no steady state supply, this circuit is dynamic and must be measured accordingly using the <transient> tab.
Lets now us LT to do something a little different. We will attempt to design a simple PSU and use LT to look at the voltages and ripple produced. We will build on that and later add a voltage doubler and a simple regulator.
Firstly we need some idea of the actual circuitry we will use. A typical idea might start off like this...
We need to translate that into a simultion so we begin by opening LT and creating a "new schematic" which you can then save under a new file name in your chosen location.
To build the circuit we need four diodes and a cap to begin. Click the "diode" symbol on the top line and drop four diodes onto the workspace. Before you make the drop, carry the attached symbol over to the "rotate" symbol (4th in from the right) and orientate them so that the circuit can be drawn out logically. Having dropped four diodes, do a right click to deselect the diode drop and now using the same method drop a cap onto the workspace.
Now wire it up neatly.
Our voltage source will be sinewave, just as if transformer fed. So we need to add a voltage source to the diode bridge input. Using the "component" symbol on the top line, open the component library and select a "voltage" source and add it to the diagram. Let us assume we have a 20 volt transformer. That 20 volts is an RMS value and LT needs a peak value to set the source up. So we multiply 20 by root 2 to arrive at 28 volts. We enter that value by right clicking the voltage source and selecting "advanced". We can also enter the other details at this point too.
What might be a good reservoir cap value. Lets use a modest 1000uf. Right click the cap and make the value 1000uf. We also must add a ground symbol to the diagram, so do that now attaching it to the 0 volt line. We also need a suitable diode. Right click each in turn and using the "pick new diode" option select the MURS320. That is a typical silicon diode. At this point we also tidy things up by using the "hand" symbol.
Information... if you right click the diodes text, that is to say the MRS320 text you get a window with options of how to palce the text, or to make it invisible if space is short.
So we can go from this,
To this.
To simulate the circuit we will initially run the sim for 2 seconds, so open the <edit simulation> option (right click the workspace) and set 2s as the transient stop time.
Now run the simulation and probe the voltage on the cap. You should see a nice steady 27 volts or so (LT has correctly accounted for the diode volt drop of the bridge). Do you remember how we could expand any section of the trace by putting the cursor over the section of interest and drawing a box around the part to expanded ?
Look closely at the start of the trace. The charging of the reservoir cap is shown correctly and if you look at just that portion of the waveform you should see something like this.
Why have we no ripple on the output ? It is because we are drawing no current so what we can do now is add a load resistor of say 30 ohms.
That will draw just under 1 amp. You should know how to attach that by now so go ahead and add the part and re-run the simulation.
Now we have lots of ripple.
Expand the trace and look at the detail.
If you hold CTRL and left clcik the trace label then just as before, we can see the voltages.
That is probably enough to be going on with for the moment... next we will add the doubler and regulator. Did you notice that we didn't run the DC op pnt command on this one. You can try it but you will find the voltages are all zero. That is because there is no steady state supply, this circuit is dynamic and must be measured accordingly using the <transient> tab.
Attachments
-
 Parts9.PNG6.6 KB · Views: 327
 -
 Parts8.PNG27.1 KB · Views: 329
 -
 Parts7.PNG49.6 KB · Views: 326
 -
 Parts6.PNG33.8 KB · Views: 333
 -
 Parts5.PNG31.6 KB · Views: 327
 -
 Parts4.PNG37.2 KB · Views: 342
 -
 Parts3.PNG52.4 KB · Views: 335
 -
 Parts2.PNG26 KB · Views: 297
 -
 Parts1.PNG21.7 KB · Views: 302
 -
 Startinging point.png24.6 KB · Views: 307
- Home
- Design & Build
- Software Tools
- Installing and using LTspice IV (now including LTXVII), From beginner to advanced