Yes, the Driver (diaph) driver graph is very useful in working with reactance annulling.
Hi just a guy,
The Driver (diaph) Driver chart will be included in the next release of Hornresp.
Kind regards,
David
Last edited:
Will there be an iOS or OSX version of hornresp?
Hi soongsc,
Sorry, there is absolutely no chance of that happening 🙂.
Kind regards,
David
Hi just a guy,
The Driver (diaph) Driver chart will be included in the next release of Hornresp.
Kind regards,
David
Ok, thank you very much.
If I am interpreting things correctly it seems that perhaps you need both - the total pressure to establish the maximum stress on the diaphragm, and the net pressure to establish if pressures are similar on each side of the diaphragm (which you appear to want for your reactance annulling experiments).
Actual pressure stress would be useful too, especially since Akabak apparently doesn't have a graph for this. I've already taken too much of your time so I'm not going to push it, whatever you decide is fine with me.
Sorry, there is absolutely no chance of that happening 🙂.
Not even if someone sends you a Mac with a MS Visual Basic compiler installed? 🙂
Bjørn
I am hoping to transition as much as possible to iOS ans OSX. Generally hoping as mobile as possible.
Not even if someone sends you a Mac with a MS Visual Basic compiler installed?
Tease!
I never do that.
I'm imagining a Macintosh apple with a "C" wearing glasses. Almost works.
I have been watching the pressure questions.
Keep it as David has stated. Easier to work out in real situations.
The most interesting parts are that in practical horns the actual balancing effects we strive for are only found in very narrow frequency bandwidths.
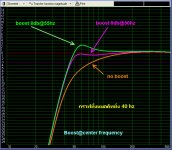
This new tool may help out in designing a more gradual roll off below Fc. That could prove useful in bass horns.
I am hoping to transition as much as possible to iOS ans OSX. Generally hoping as mobile as possible.
Win8.1 tablet would do that 🙂
I've been looking at some of the new 8" Win8.1 tablets on the market at the moment. Nice stuff. Pity only one USB port though, but it might be possible to work around that.
Windows products never got as fine tuned as I had hoped they would. I think it's because they have think features is quality, but really mess up with how the features are arranged. All the patches they put in over the years not only mess up performance, but also mess up compatibility with existing software. I doubt they will get rid of those bad habits soon.
Not even if someone sends you a Mac with a MS Visual Basic compiler installed? 🙂
Not even then - just keeping one version of Hornresp working is difficult enough 🙂.
Hi just a guy,
Not at all - I found the discussion to be most interesting. It encouraged me to think more analytically about what the AkAbak Driver (diaph) Driver results really mean 🙂.
The summing formula I gave is correct for the data as presented in the AkAbak charts, where the pressures on both the front and rear sides of the driver diaphragm are shown as positive values. That is:
((P1R + P2R) ^ 2 + (P1X + P2X) ^ 2) ^ 0.5
For a vibrating diaphragm however, when the instantaneous front-side pressure P1 is positive (compression) the rear-side pressure P2 is negative (rarefaction). This means that strictly speaking, a difference formula rather than a summing formula should be used to obtain the same correct result. That is:
((P1R – (–P2R)) ^ 2 + (P1X – (–P2X)) ^ 2) ^ 0.5
This makes more sense - you may recall that early on in the discussion I had assumed that the Driver (diaph) Driver result should be a vector difference and not a vector sum.
In Hornresp I have called the Driver (diaph) Driver result the "Total" pressure. It shows the difference between the pressures on the front and rear sides of the driver diaphragm with all phase shifts taken into account. When sampled, the calculated force value represents the total "stress" on the diaphragm in kilograms-force.
Because the Driver (diaph) Driver chart appears to be sufficient for your reactance annulling experiments, I have not included a chart showing the sum of the pressures on the front and rear sides of the driver diaphragm with phase taken into account. In other words, a chart based on the following formula has not been added:
((P1R + (–P2R)) ^ 2 + (P1X + (–P2X)) ^ 2) ^ 0.5
Kind regards,
David
I've already taken too much of your time
Not at all - I found the discussion to be most interesting. It encouraged me to think more analytically about what the AkAbak Driver (diaph) Driver results really mean 🙂.
Actual pressure stress would be useful too, especially since Akabak apparently doesn't have a graph for this.
The summing formula I gave is correct for the data as presented in the AkAbak charts, where the pressures on both the front and rear sides of the driver diaphragm are shown as positive values. That is:
((P1R + P2R) ^ 2 + (P1X + P2X) ^ 2) ^ 0.5
For a vibrating diaphragm however, when the instantaneous front-side pressure P1 is positive (compression) the rear-side pressure P2 is negative (rarefaction). This means that strictly speaking, a difference formula rather than a summing formula should be used to obtain the same correct result. That is:
((P1R – (–P2R)) ^ 2 + (P1X – (–P2X)) ^ 2) ^ 0.5
This makes more sense - you may recall that early on in the discussion I had assumed that the Driver (diaph) Driver result should be a vector difference and not a vector sum.
In Hornresp I have called the Driver (diaph) Driver result the "Total" pressure. It shows the difference between the pressures on the front and rear sides of the driver diaphragm with all phase shifts taken into account. When sampled, the calculated force value represents the total "stress" on the diaphragm in kilograms-force.
Because the Driver (diaph) Driver chart appears to be sufficient for your reactance annulling experiments, I have not included a chart showing the sum of the pressures on the front and rear sides of the driver diaphragm with phase taken into account. In other words, a chart based on the following formula has not been added:
((P1R + (–P2R)) ^ 2 + (P1X + (–P2X)) ^ 2) ^ 0.5
Kind regards,
David
Hornresp Update 3310 - 131211
Hi Everyone,
CHANGE 1
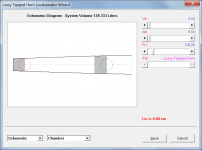
Tapped horns containing absorbent filling material can now be simulated in the Loudspeaker Wizard - similar to offset driver horns.
CHANGE 2
Absorbent filling can now be specified for individual horn segments in both offset driver and tapped horns. Double-click on a Loudspeaker Wizard length slider value to toggle filling on or off for that segment. Attachment 1 refers.
CHANGE 3
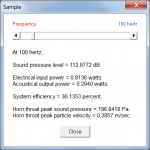
The functionality of the main Sample tool has been altered. The tool is still opened by either selecting the Tools > Sample menu, pressing F3 or double-clicking the chart, but a frequency value can now be entered by typing in the number and then pressing the Enter key, or alternatively by using the slider. The tool no longer has to be closed to enter a different sample frequency for the currently displayed chart. The abbreviated sample feature can still be used as before, by single-clicking on the chart.
The Up/Down/Left/Right arrow keys, the PgUp/PgDn keys and the Home and End keys can also be used to vary the slider frequency value.
Attachment 2 refers.
CHANGE 4
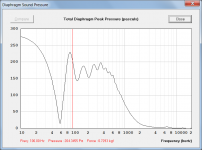
A chart has been added displaying the difference between the pressures on the two sides of the driver diaphragm after taking phase into account. Attachment 3 refers.
CHANGE 5
The Sample tool for the diaphragm pressure charts now also calculates the force in kilograms acting on the driver diaphragm. Attachment 3 refers.
My thanks to 'just a guy' and David_Web for prompting the above changes.
Kind regards,
David
Hi Everyone,
CHANGE 1
Tapped horns containing absorbent filling material can now be simulated in the Loudspeaker Wizard - similar to offset driver horns.
CHANGE 2
Absorbent filling can now be specified for individual horn segments in both offset driver and tapped horns. Double-click on a Loudspeaker Wizard length slider value to toggle filling on or off for that segment. Attachment 1 refers.
CHANGE 3
The functionality of the main Sample tool has been altered. The tool is still opened by either selecting the Tools > Sample menu, pressing F3 or double-clicking the chart, but a frequency value can now be entered by typing in the number and then pressing the Enter key, or alternatively by using the slider. The tool no longer has to be closed to enter a different sample frequency for the currently displayed chart. The abbreviated sample feature can still be used as before, by single-clicking on the chart.
The Up/Down/Left/Right arrow keys, the PgUp/PgDn keys and the Home and End keys can also be used to vary the slider frequency value.
Attachment 2 refers.
CHANGE 4
A chart has been added displaying the difference between the pressures on the two sides of the driver diaphragm after taking phase into account. Attachment 3 refers.
CHANGE 5
The Sample tool for the diaphragm pressure charts now also calculates the force in kilograms acting on the driver diaphragm. Attachment 3 refers.
My thanks to 'just a guy' and David_Web for prompting the above changes.
Kind regards,
David
Attachments
Hi Everyone,
CHANGE 1
Tapped horns containing absorbent filling material can now be simulated in the Loudspeaker Wizard - similar to offset driver horns.
CHANGE 2
Absorbent filling can now be specified for individual horn segments in both offset driver and tapped horns. Double-click on a Loudspeaker Wizard length slider value to toggle filling on or off for that segment. Attachment 1 refers.
Hi David, I just downloaded the latest version, but I can't seem to get this to work. Double-clicking on the length slider values doesn't seem to do anything...
Hi just a guy,
Not at all - I found the discussion to be most interesting. It encouraged me to think more analytically about what the AkAbak Driver (diaph) Driver results really mean 🙂.
Ok, then let me take one more minute then to make sure I fully understand. I was almost 100 percent certain that the Driver (diaph) Driver graph was showing actual stress on the cone until post 3838 in which you thoroughly confused me, but now with this latest post I think I was correct in the in the first place.
Allow me to go step by step and please let me know if and at what point I make an error. (I'm not going to use the words sum, difference, net and total, for some reason these words seem to be causing issues, maybe I'm using these terms incorrectly.)
The Driver (diaph) Driver graph uses this formula.
((P1R + P2R) ^ 2 + (P1X + P2X) ^ 2) ^ 0.5
This formula could be expressed in the following way but gives the exact same result. (The double negatives cancel out.)
((P1R – (–P2R)) ^ 2 + (P1X – (–P2X)) ^ 2) ^ 0.5
This is a picture of a compound horn with identical horn flares on the front and rear.
It's a large horn, each flare contains 1 lb of air.
An externally hosted image should be here but it was not working when we last tested it.
To simplify things to a level that I can easily understand, if the cone moves towards the right (as per the red arrow) the cone has to simultaneously pull 1 lb of air in the left horn and push 1 lb of air in the right horn. So the actual stress on the cone is 2 lbs.
Although this is a gross oversimplification, this represents what the Driver (diaph) Driver graph shows - the actual stress on the cone.
Now there's another formula you have mentioned.
((P1R + (–P2R)) ^ 2 + (P1X + (–P2X)) ^ 2) ^ 0.5
Akabak does not have a graph for this.
If this formula is grossly oversimplified in the same manner it becomes 1 lb - 1 lb = 0 lbs. It does NOT show the actual stress on the cone. I'm not sure this information has any practical purpose at all for enclosure design.
To sum it up, the Driver (diaph) Driver graph in Akabak and the Total Pressure graph in Hornresp show the actual cone stress.
Last edited:
Is acoustic stress on the cone more than the mass induced stress? Seems to me it would be less.
Hi David, I just downloaded the latest version, but I can't seem to get this to work. Double-clicking on the length slider values doesn't seem to do anything...
Tried a couple dozen things and nothing worked for me either 🙁
Double-clicking on the length slider values doesn't seem to do anything...
Hi Brian,
Fr1 needs to be non-zero for the feature to work, otherwise things can get quite confusing. Moving the mouse pointer over a blue length value when Fr1 is non-zero should turn the font from regular to bold. Double-clicking on the value while the font is bold should remove the filling from that segment and change the colour of the length slider caption from pink back to the default red. Pink is used to indicate that a segment contains filling material, which might otherwise not be immediately obvious to the user unless the schematic diagram is being viewed.
Could you please let me know if there is still a problem with the operation of the feature.
Kind regards,
David
hi david u can put the eq like win isd?
thx
Hi Thawach,
The existing Filter Wizard tool is as far as I am prepared to go in terms of signal processing.
Kind regards,
David
- Home
- Loudspeakers
- Subwoofers
- Hornresp