The problem that I have with this is that were this true, it would not be possible to create a model from the raw FR of a driver and accurately reproduce the HBT generated phase across the board. I question the accuracy of this claim from an empirical standpoint. I've been able to measure a 10" woofer with serious "breakup" (an older 10" Vifa) and match HBT phase to measured phase up to 20KHz in excruciating detail. It requires software such as CALSOD to do this since most software is not able to adjust the sample points to a different frequency such as is possible with CALSOD. I have a version that uses 700 sample points. I can set the optimization range to be 19KHz-20KHz that then places the entire 700 points within that range, allowing me to create a nearly perfect match to all variations, breakup, whatever.AS Elias suggested, re-worded, the problem is the driver has it’s own phase response and if you look with a time ruler, unless at zero, you see that represents a time delay that changes with frequency.
If you consider it as Richard Heyser did, it is as if the physical depth location of the source changes with frequency.
I suppose it is possible that minor alterations in the selected lowpass extension required to go beyond the measured FR adjusts the change in the generated phase, but even so I would not expect the result to nearly perfectly match as it always has for me.
The amount of error that may be introduced by shifting radiation areas is in my experience, miniscule. For typical crossover design requirements, it's moot.
Dave
Edit: My experience is almost purely with direct radiators, not horns, so I don't know how that may alter the result. But given that most horns use small compression drivers, I would expect less variation with the apparent acoustic center vs. a large area dynamic radiator.
Last edited:
Not necessarily. It depends upon the measurement system. I use LAUD, have since 1998. It is limited to 24K. Many tweeters go well beyond this point, so it's best to "tail" the response and approximate the lowpass supplied by the manufacturer. This is done because if one is to use the HBT, most software requires data beyond the measured cutoff. CALSOD extends the result flat beyond the last measurement point if not tailed. It still works, I didn't tail for a long time, so it's not absolutely necessary. Just don't change the model after determining the offset.From some private communications -around 1994-with Wittold Waldman, the CALSOD designer, it appeared that with a single point (do not touch/move the box and mic) it is not even neccessary to manipulate the measurement files. DLR, I think however, has a slightly different view.
I also will tail the lowpass of a woofer or mid as much to prevent an optimizer from unduly altering the response from some of the FR anomalies that may not be far down into the stop-band. It just makes the process easier.
Dave
I've re-read your original post and think I have a better feel for what you are looking for.
Your described method was to measure group delay of the full system and then look for two representative flat areas (in a 2 way system). I don't think that gives any uniquely valid information.
In your preamble I think you are looking for acoustic center offset and have hopes of equalizing it so that a practical filter can be matched to theoretical filters in an otherwise delayless system. If your interest is in physical driver offset then you will need to look at drivers without networks (of course). Even systems split into sections will not give an offset tied to physical parameters (such as voice coil depth) since the filters will add an unknown extra delay for the woofer and advance for the tweeter.
To me the only way to come up with useful numbers is the Hilbert Transform phase comparison to actual phase. Since you have group delay measurement as an option then group delay of the unit vs. group delay of the Hilbert transform should be parallel curves that can be subtracted for a single valued answer. Alternatively slide the related impulse response forwards and backwards until the phases match or use any program options available.
Be careful about any "first non-zero value" of the impulse response approaches. A lot of FFT programs have some pre-ringing of the measured impulse response and this will mess with accuracy. I certainly don't think the relative peaks of the impulse responses have any significance either.
With your goal in mind I'd really favor finding the acoustic center offsets. Once they are found you've accounted for the only non minimum phase part and from there on you can add filters to your hearts content and know that they are all minimum phase changes being made.
David S.

David (dlr),
I've looked at your method and I really like its simplicity. Just to get this straight:
- Measure each driver individually and as a pair (three measurements total for a 2-way)
- Calculate the minimum-phase with the HBT.
- Load the data into a CAD program.
- In the program give the farthest driver just the right amount of delay so that the simulated combined response of the two drivers gets identical to the measured pair.
The amount of delay necessary is the relative delay time between the two drivers.
I like it! It's simple, yet it makes sense. I'll try it next time I measure some speakers and I'll compare the outcome with the aforementioned minimum-phase / measured phase comparison method I usually use.
Martijn
In fact one of my goals was to be able to measure the acoustic offset in any existing design with a single measurement without disassembly of the speaker or crossover/wiring, and I'm not aware of any other approaches which will do this with any degree of accuracy.
Still catching up with your objective so pardon any repetition.
Isn't this simply taking a group delay (vs. frequency) measurement? I don't know why there would be any accuracy issues here other than the fact that a differentiated (phase) curve is usually pretty furry. If the notion is that the group delay curve will tell you exact acoustic center offset, I don't think that is correct, since the networks add unknown phase shift to each section and the particular manner in which the sections add will impact delay through the crossover region.
It might be worthwhile to do a number of 2 way simulations and see how the group delay curves of the 2 raw drivers morph into a combined group delay of the system. I assume that well away from the crossover point there would be remnants of the driver group delay curve but this also depends on how much EQ you need to build into the network.
You have 2 choices: take the group delay curve at face value for whatever it means, or dissect the system and do the Hilbert Transform approach to get true acoustic center locations.
Thinking more from last night, if the drivers are minimum phase and the network is minimum phase then removing the networks isn't necessary. Just splitting sections should let you find minimum phase comparisons of the two sections. That can give you true offset between sections which we can assume is driver determined.
David S.
That's it with some details to make sure it's clear. The first (with a caveat I'll add later) is that the CAD program should have the 3-d locations in space specified for drivers and mic. This provides the excess delay due to not being coincident drivers (such as a coax). You select some reference (I usually use the baffle surface) when making the measurements and use this in CAD.I've looked at your method and I really like its simplicity. Just to get this straight:
- Measure each driver individually and as a pair (three measurements total for a 2-way)
- Calculate the minimum-phase with the HBT.
- Load the data into a CAD program.
- In the program give the farthest driver just the right amount of delay so that the simulated combined response of the two drivers gets identical to the measured pair.
The amount of delay necessary is the relative delay time between the two drivers.
The second point is that you can alter either driver's offset, but it's probably best to adjust the driver with the deepest offset from the reference. Since tweeters are usually not deep, their center is not far from the front of the faceplate. The caveat I mentioned is that since we cannot know the precise acoustic center of any driver, there will always be a small amount of error, even using the tweeter as the (0,0,0) reference because it could really be something like (0,0,-5mm) or some such value. The small amount of geometry error won't have any significant impact.
After adding the appropriate delay to the woofer (when adjusting it for the z-axis offset), the result is the relative offset of the woofer to that specific tweeter for the z-axis. What this provides to the CAD software is total delay, x-axis for horizontal placement on the baffle, y-axis for vertical displacement between drivers on the baffle and the z-axis for the physical difference between drivers from the reference (the baffle surface example).
You can also do this with either polarity for any driver, just be sure that the CAD program is set up to match it. As a rule I always connected both in positive polarity.
If you design to a single point only and do not wish to investigate other points in space for the microphone, the only thing needed in absolute sense is the total delay. You can simply set the woofer and tweeter at (0,0,0) and add delay to the woofer z-axis for the total delay from the three axes. This will not give you the relative acoustic offset between individual drivers, it gives you the total delay as seen at the microphone position where you made the measurements, the same delay as in the 3-d model. The physical equivalent would be having the woofer and tweeter in-line with the woofer offset quite some distance behind the tweeter. This doesn't work in the real world, of course, but for design in CAD it can. The limitation is that you can't then move the mic position in CAD to investigate other points because this will introduce error in the total excess-delay.
I have always measured with raw tweeters, no cap for protection, because it can be done at very low power. I've even measured ribbon tweeters that way. If you do that, just be careful with power setting. I've seen recommendations to always measure with something like a 100uF cap on the tweeter. This will help protect against power amp turn-on or other issues and probably won't create an issue with the tweeter highpass. The cap won't alter the excess delay so you should still get accurate results for offset.
Dave
Not group delay, excess group delay.I've re-read your original post and think I have a better feel for what you are looking for.
Your described method was to measure group delay of the full system and then look for two representative flat areas (in a 2 way system). I don't think that gives any uniquely valid information.
I'm sure everyone in this thread knows the difference, but the way many peoples posts are worded suggests to me that they are not focusing on the distinction between the two and coming away with the wrong conclusions because of it.
That's one possible use for it, but achieving a particular on-axis target response is not my only reason for wanting to know what the offset is, I'm also thinking about the other issues I mentioned like inverse square law tracking, off axis variations in acoustic centre offset, and also the unanswered question of how much wide band group delay is acceptable between two bands (midrange and treble particularly) in regards to imaging and coherence.In your preamble I think you are looking for acoustic center offset and have hopes of equalizing it so that a practical filter can be matched to theoretical filters in an otherwise delayless system.
All reasons why I (but perhaps nobody else) think its useful to have some good way to measure the offset.
Really though, I don't think the reasons for wanting to measure the acoustic offset of two drivers is that relevant to techniques to actually measure it, although the way the thread has gone it seems to have turned into "why would you want to measure it" rather than "how can you measure it".
I think you're tripping up on the distinction between group delay and excess group delay here.If your interest is in physical driver offset then you will need to look at drivers without networks (of course). Even systems split into sections will not give an offset tied to physical parameters (such as voice coil depth) since the filters will add an unknown extra delay for the woofer and advance for the tweeter.
Yes the individual high pass and low pass sections will add phase shift and therefore group delay, however this phase shift is minimum phase.
If no excess phase is added by the high and low pass filters then it makes no difference to the excess group delay - it's cancelled out.
(I guess if you had an all-pass response contained within one section of a crossover, like a lattice phase equalizer this assumption would fall apart, but most crossovers even with amplitude response corrections will be minimum phase?)
In front of me I'm looking at individual measurements of woofer and tweeter crossed over at 4Khz, and their excess group delay curves are almost dead flat over a wide range despite the high pass and low pass filters being in place. The main source of inaccuracy seems to be limitations imposed at the low frequency end by the FFT window size, but that's always going to be the case.
Which is precisely what excess group delay is measuring! 😀To me the only way to come up with useful numbers is the Hilbert Transform phase comparison to actual phase. Since you have group delay measurement as an option then group delay of the unit vs. group delay of the Hilbert transform should be parallel curves that can be subtracted for a single valued answer.
ARTA is calculating excess phase by subtracting Hilbert Transform calculated minimum phase from actual measured phase, and then differentiating the excess phase to get excess group delay, which is equivalent to the method you're suggesting.
Good to know, I have never found judging the start of an impulse rise accurate, this is just one more reason not to trust it. That's why I like the fact that the excess group delay approach doesn't rely on dealing with the impulse response in the time domain.Alternatively slide the related impulse response forwards and backwards until the phases match or use any program options available.
Be careful about any "first non-zero value" of the impulse response approaches. A lot of FFT programs have some pre-ringing of the measured impulse response and this will mess with accuracy. I certainly don't think the relative peaks of the impulse responses have any significance either.
All you need to do is adjust the zero time of the "reference" driver by adjusting delay time for phase estimation until the broad shallow bottom of the curve for that driver corresponds to zero excess group delay, and use that as a reference point.
Yes, the group delay curve is very furry due to the amplitude response also being furry, however the excess group delay curve is extremely smooth - the one I posted in the original post is not smoothed, (well, 1/24th octave) it really is that smooth. On the other hand the group delay curve is extremely lumpy with bumps up to 10 times the magnitude of the excess group delay curve simply due to amplitude variations.Still catching up with your objective so pardon any repetition.
Isn't this simply taking a group delay (vs. frequency) measurement? I don't know why there would be any accuracy issues here other than the fact that a differentiated (phase) curve is usually pretty furry. If the notion is that the group delay curve will tell you exact acoustic center offset, I don't think that is correct, since the networks add unknown phase shift to each section and the particular manner in which the sections add will impact delay through the crossover region.
This is pretty much the same comment from your last message, to which I say you're confusing group delay with excess group delay.It might be worthwhile to do a number of 2 way simulations and see how the group delay curves of the 2 raw drivers morph into a combined group delay of the system. I assume that well away from the crossover point there would be remnants of the driver group delay curve but this also depends on how much EQ you need to build into the network.
Which is what I'm doing with excess group delay.You have 2 choices: take the group delay curve at face value for whatever it means, or dissect the system and do the Hilbert Transform approach to get true acoustic center locations.
Now you're coming around 🙂Thinking more from last night, if the drivers are minimum phase and the network is minimum phase then removing the networks isn't necessary. Just splitting sections should let you find minimum phase comparisons of the two sections. That can give you true offset between sections which we can assume is driver determined.
Last edited:
The caveat I mentioned is that since we cannot know the precise acoustic center of any driver, there will always be a small amount of error, even using the tweeter as the (0,0,0) reference because it could really be something like (0,0,-5mm) or some such value. The small amount of geometry error won't have any significant impact.
Dave
Is this true? I know if we look at group delay it isn't a single valued number, but if we compare measured phase to HBT phase, we should have an excess phase amount that converts to an exact distance. It may vary with angle, so there isn't a hard point for all angles, but can't we come up with a real source depth?
David S.
Not group delay, excess group delay.
I'm sure everyone in this thread knows the difference, but the way many peoples posts are worded suggests to me that they are not focusing on the distinction between the two and coming away with the wrong conclusions because of it.
Okay, I'll plead ignorance.
Please give us your definitions, just to make sure we are all on the same page.
David S.
Okay, I'll plead ignorance.
Please give us your definitions, just to make sure we are all on the same page.
David S.
Group delay = the first differential of total phase.
Excess group delay = the first differential of excess phase.
That's my understanding...
The ARTA manual has this brief comment on it:
"Sometimes it is useful to analyse the excess group delay. It is a group delay obtained from the excess phase characteristics."
EDIT: Oops! I didn't see Simon's reply.
I thought "excess group delay" was group delay with the frequency dependent part removed. So you are left with just time delay. Simon?
How would this work thru a crossover? Will ARTA or other software be able to sort the drivers from the crossover? That seemed to be what Simon was suggesting, by looking for a plateau.
If we have air path delay = delay due to distance from the microphone to the acoustic center of the driver,
and all pass delay = additional delay attributed to any all pass elements (networks),
is excess group delay one or the other, or both of those?
David
and all pass delay = additional delay attributed to any all pass elements (networks),
is excess group delay one or the other, or both of those?
David
Some years ago I spent considerable time trying to find a way to determine absolute acoustic center. Nothing worked. I know of one other person who I respect who was doing so simultaneously, so we discussed our efforts. Neither one of us was successful. Not too long after that there was a working group within the AES (I think it was them) that was given the same task. My understanding is that they were also unsuccessful when they closed the group.Is this true? I know if we look at group delay it isn't a single valued number, but if we compare measured phase to HBT phase, we should have an excess phase amount that converts to an exact distance. It may vary with angle, so there isn't a hard point for all angles, but can't we come up with a real source depth?
David S.
The reason why has to do with the basic method. It's a simple task to measure phase today, it's a simple task to generate phase with the HBT, but therein lies the rub. The HBT is based on an FR with assumptions. Those relate to the highpass and, more importantly, the lowpass. Older systems such as mine (LAUD) had limitation to 24K, others maybe to 30K. The HBT algorithms use data beyond that, so either the user creates it or the software has to extend with some assumption, often continuing the curve from the last data point either flat or at the same slope. Either way, it's an assumption.
Add to that the issue of whether or not there is a point at the upper end where the FR may start to be non-MP (I've never been convinced that it is). That adds additional uncertainty, even for the current systems that can measure to higher frequency.
In a bit of a simplistic way, it's a bit like the Heisenberg Uncertainty Principle. The more precise we try to be about the driver SPL, the less certain we are about the accuracy of the corresponding HBT phase that is generated from it. We have no other means of determining the true MP response.
To actually measure true MP we have to first know the absolute acoustic center (AAC) so that we can remove the correct amount of excess phase from the measurement (assuming we know the effective AAC of the measuring microphone!). But to know the AAC we have to know the SPL response with certainty, since we must use that to generate the HBT phase.
There are similar uncertainties with other methods, such as the impulse response. There are just too many dependencies and uncertainties.
The only thing we need for design, however, is the relative acoustic offset unless one designs from measurements directly. I've done the latter a fair amount in situations where I understood what would occur at other points than the mic measurement position. The relative offset is one of the easiest design considerations. It is not an absolute, it is dependent only upon the SPL frequency response and we can even use variations in the FR as long as the model is not changed after the phase is generated with the HBT. Change the lowpass slope of one driver and the excess phase changes. But all we need do is change the offset of the driver by the same amount on its z-axis in the model and the relative offset that results will still give us exactly the same summed response as before. That's why I abandoned efforts on the absolute, all that's needed to design is the relative.
The offset may change with angle as well, though I've not tested that. I was told that it does and I can see why it would. But other considerations off-axis are probably of much greater concern, though it's one reason I have used offset midrange units to try to align the centers on the z-axis. Changes in diffraction and driver directionality will be orders of magnitude larger than most changes in the relative offset for most systems, at least for lateral changes in axis.
Sorry for verbose response. It started out short. 🙁
Dave
For design purposes, absolutely. 😱Dave, glad you got to the relative part - that's what really matters, isn't it?
Dave

Both.If we have air path delay = delay due to distance from the microphone to the acoustic center of the driver,
and all pass delay = additional delay attributed to any all pass elements (networks),
is excess group delay one or the other, or both of those?
Just think about where excess phase comes from and then you can immediately see what excess group delay will and won't show.
If you measure each driver on it's own most drivers will be almost perfectly minimum phase, with a few special cases.
One exception is a dual cone driver which is definitely not minimum phase at high frequencies, showing an all-pass like excess phase curve and group delay peak due to its mechanical crossover. That's an uncommon case for a multi-way design though.
Another possible exception is what dlr alluded to earlier - that some drivers may show a little bit of excess group delay increase right at the top end of their range - my speculation is that this only occurs on drivers that are physically large for the frequencies involved, (so far I've only seen it on full range drivers, not tweeters) and happens due to a shrinking effective radiating area pushing back the effective acoustic centre...(in this case the acoustic centre really is moving slightly at high frequencies)
Anyway in the majority of cases the driver is minimum phase over the bandwidth of interest. If you then add the crossover, most crossovers sections are also going to be minimum phase, unless you had some kind of special all-pass correction within a single drivers section. (Does anyone do this passively ?) So adding the individual crossover sections doesn't change the excess group delay reading. (experimentally verified on a simple 3rd order high/low pass filter)
All that's left to generate excess phase is the all-pass function formed by the summation of the two drivers, and the acoustic offsets, so these are the only two things that will show up in excess group delay.
So at and near the crossover frequency the excess group delay is largely due to the all-pass function of the overall speaker, and far enough away from the crossover frequency (when the opposing driver is sufficiently attenuated) the excess group delay should be only that due to distance.
How far down in dB the opposing driver has to be before the curve "levels out" I'm not sure... probably at least 20dB, which suggests that a steeper filter would give a more reliable reading despite a greater peak at the crossover frequency. Something like a 4th order L-R might be a good choice for measurement purposes.
EDIT: Oops! I didn't see Simon's reply.
I thought "excess group delay" was group delay with the frequency dependent part removed. So you are left with just time delay. Simon?
How would this work thru a crossover? Will ARTA or other software be able to sort the drivers from the crossover? That seemed to be what Simon was suggesting, by looking for a plateau.
See above.
Last edited:
Before digital delay became wide bandwidth, low noise and inexpensive, all pass filters were often used for phase shaping and time delay.Anyway in the majority of cases the driver is minimum phase over the bandwidth of interest. If you then add the crossover, most crossovers sections are also going to be minimum phase, unless you had some kind of special all-pass correction within a single drivers section. (Does anyone do this passively ?) So adding the individual crossover sections doesn't change the excess group delay reading. (experimentally verified on a simple 3rd order high/low pass filter)
All pass filters can be implemented passively using inductors and capacitors, or with op amps which eliminate the need of inductors.
Urei, Renkus Heinz, and others have used speaker level all pass filters to correct small time offsets that physically would have been impossible to correct, as in co-axial speakers where the HF to LF distance is fixed.
The combination of passive crossover/driver and physical distance offset utilized in DSL's Synergy horns probably could be considered an all-pass correction, making it possible for the speaker to reproduce a square wave over a decade range encompassing the response of three different driver types.
Speaker level passive all pass filters are very tricky to get right..
Art Welter
David (dlr),
I've looked at your method and I really like its simplicity. Just to get this straight:
- Measure each driver individually and as a pair (three measurements total for a 2-way)
- Calculate the minimum-phase with the HBT.
- Load the data into a CAD program.
- In the program give the farthest driver just the right amount of delay so that the simulated combined response of the two drivers gets identical to the measured pair.
The amount of delay necessary is the relative delay time between the two drivers.
I like it! It's simple, yet it makes sense. I'll try it next time I measure some speakers and I'll compare the outcome with the aforementioned minimum-phase / measured phase comparison method I usually use.
Martijn
Yes, I use it all the time and the method is very accurate and simple to use. I always have a match between the simulated frequency respone with the actual measured response of the finished cross-over design.
/Göran
Last edited:
Hello, all. 
I would like to relate some success I have had determining acoustic offsets between drivers using the unwrapped phase minus the minimum phase method mentioned by a few above, with a few added analytical tricks.
I thought it better to bump up this old thread rather than start a new one.
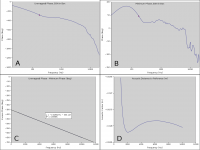
Using ARTA, I measured two drivers in a prototype enclosure without moving the baffle or microphone between measurements. On the attached plots, graph A is the unwrapped phase for one driver, a B3N, from 20Hz to 20kHz. Note that the phase does not include the entire delay to the microphone; I moved the gate start cursor in ARTA to just before the impulse. Importantly, I retained this marker for the second driver. Thus, the distances calculated are not fully to the microphone, but rather to a "phantom microphone" closer to the drivers, if you like. Since I am interested in the relative acoustic offsets this works fine for me. This method would work well to determine the relative acoustic offset of two drivers mounted on test baffles, ensuring that the distance from the baffle to the microphone is identical. But, since I had already designed the enclosure, this was purely academic for me. I suppose if you are interested in an absolute offset for a driver you could use the entire impulse from time 0ms knowing the baffle to microphone distance precisely.
Graph B is the calculated minimum phase for this driver. The markers on the graphs indicate the time-bandwidth limit for the gated response as reported by ARTA. From the looks of the graph it seems this should be higher, though I haven't investigated this.
Graph C is the unwrapped phase data minus the minimum phase data calculated with a spreadsheet. Since we're interested in the range where a crossover frequency will be used, the frequency range plotted is 1kHz to 10kHz. In this span the graph is very linear (on a linear x-axis) indicating this represents a pure time delay. Below this the data departs from linear because of the time-bandwith limit, and above the range it departs due to the phase response of my preamp, I believe. A linear regression is plotted on the graph with a very good fit indicated by the regression coefficient. Note that for a perfect time delay the y-intercept would be 0, but here it is indicated as about -353 deg; again this is due to the low frequency limitations of the measurement and for the method I used here it does not matter.
That is because I calculated the acoustic offset using just the slope of the line indicated in the equation box:
L = (c*m)/360 (meters), where
c = speed of sound, m/s
m = slope of fitted line, deg/Hz
For this example, the calculated offset from the reference location is -2.793cm.
If desired, the phase data at each frequency can be used for the calculation of the offset if the data is adjusted by subtracting the y-intercept value from the fitted line equation:
L = (c/f) * [(Punw - Pmin - b)/360] (meters), where
f = frequency (Hz)
Punw = unwrapped phase data (deg)
Pmin = minimum phase data (deg)
b = y-intercept (deg)
This is plotted in graph D. Note the full range of the graph spans just 2mm and the values agree well with the value calculated from the slope alone. This method is interesting to me because it allows investigation of the acoustic center of a driver versus frequency.
The same measurement and calculation was done for my second driver, a tweeter, and its offset to the reference location was calculated as -4.677cm. (If a tweeter center that is located behind the driver's seems odd, that is because I am using a slanted baffle.)
After some fun trigonometry to account for the angle from the woofer to the microphone, a relative offset between the drivers in the z dimension (parallel to the floor) of 2.24cm was determined. When I compared this to a scale CAD drawing of the enclosure and drivers, the result jived well with the physical placements: a good sanity check for me.
For all the explanation above, this method just uses a very simple spreadsheet calculation. I'm interested in comments on the method and result presented.
Cheers,
Dan
I would like to relate some success I have had determining acoustic offsets between drivers using the unwrapped phase minus the minimum phase method mentioned by a few above, with a few added analytical tricks.
I thought it better to bump up this old thread rather than start a new one.
Using ARTA, I measured two drivers in a prototype enclosure without moving the baffle or microphone between measurements. On the attached plots, graph A is the unwrapped phase for one driver, a B3N, from 20Hz to 20kHz. Note that the phase does not include the entire delay to the microphone; I moved the gate start cursor in ARTA to just before the impulse. Importantly, I retained this marker for the second driver. Thus, the distances calculated are not fully to the microphone, but rather to a "phantom microphone" closer to the drivers, if you like. Since I am interested in the relative acoustic offsets this works fine for me. This method would work well to determine the relative acoustic offset of two drivers mounted on test baffles, ensuring that the distance from the baffle to the microphone is identical. But, since I had already designed the enclosure, this was purely academic for me. I suppose if you are interested in an absolute offset for a driver you could use the entire impulse from time 0ms knowing the baffle to microphone distance precisely.
Graph B is the calculated minimum phase for this driver. The markers on the graphs indicate the time-bandwidth limit for the gated response as reported by ARTA. From the looks of the graph it seems this should be higher, though I haven't investigated this.
Graph C is the unwrapped phase data minus the minimum phase data calculated with a spreadsheet. Since we're interested in the range where a crossover frequency will be used, the frequency range plotted is 1kHz to 10kHz. In this span the graph is very linear (on a linear x-axis) indicating this represents a pure time delay. Below this the data departs from linear because of the time-bandwith limit, and above the range it departs due to the phase response of my preamp, I believe. A linear regression is plotted on the graph with a very good fit indicated by the regression coefficient. Note that for a perfect time delay the y-intercept would be 0, but here it is indicated as about -353 deg; again this is due to the low frequency limitations of the measurement and for the method I used here it does not matter.
That is because I calculated the acoustic offset using just the slope of the line indicated in the equation box:
L = (c*m)/360 (meters), where
c = speed of sound, m/s
m = slope of fitted line, deg/Hz
For this example, the calculated offset from the reference location is -2.793cm.
If desired, the phase data at each frequency can be used for the calculation of the offset if the data is adjusted by subtracting the y-intercept value from the fitted line equation:
L = (c/f) * [(Punw - Pmin - b)/360] (meters), where
f = frequency (Hz)
Punw = unwrapped phase data (deg)
Pmin = minimum phase data (deg)
b = y-intercept (deg)
This is plotted in graph D. Note the full range of the graph spans just 2mm and the values agree well with the value calculated from the slope alone. This method is interesting to me because it allows investigation of the acoustic center of a driver versus frequency.
The same measurement and calculation was done for my second driver, a tweeter, and its offset to the reference location was calculated as -4.677cm. (If a tweeter center that is located behind the driver's seems odd, that is because I am using a slanted baffle.)
After some fun trigonometry to account for the angle from the woofer to the microphone, a relative offset between the drivers in the z dimension (parallel to the floor) of 2.24cm was determined. When I compared this to a scale CAD drawing of the enclosure and drivers, the result jived well with the physical placements: a good sanity check for me.
For all the explanation above, this method just uses a very simple spreadsheet calculation. I'm interested in comments on the method and result presented.
Cheers,
Dan
Attachments
- Status
- Not open for further replies.
- Home
- Loudspeakers
- Multi-Way
- Measuring driver acoustic offset using excess group delay ?