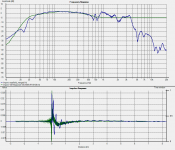
the above SPL plot shows a problem at around 22 Hz.
That depends on the goodness of the measurement. In this area of the frequency spectrum and below one often encounters problems with noise in the measurement system and reflections from the environment. Also, there are so few data points here that it is difficult to differentiate useful data from that which can be misleading. It can send one on a wild goose chase.
Thanks Guys, as I said this box was a compromise (and it is a big one!) It was originally built for a 12" Plessey driver by someone else. It is 16mm chipboard, NO bracing and not particularly well made, had massive leaks which I have tried to seal up with sicaflex. I figured with the length of time it takes me to get things done I should at least make my active crossover to work with these boxes for a while and then make some decent boxes properly.
Oh and I forgot the ports are terminating too close to the back panel as well... probably only about 6cm clearance...
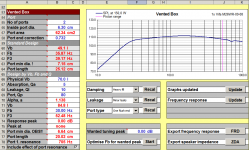
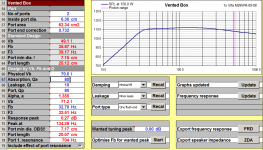
I averaged the two sets of T/S params and put them into unibox. Interestingly I needed to say the box had heavy fill to get it to give me the port length I have (and a 30Hz tuning). There is no stuffing in the box, but the lining (polyester) is a bit oversized and bulges a bit...
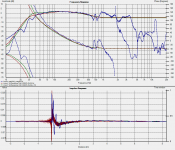
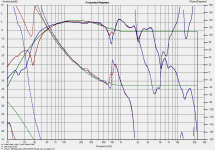
I chose to use the Le2 and re2 measurements in unibox and get it to model with those taken into account. apart from the falling off a cliff at 40Hz the real measurement follows the sim pretty closely. I certainly think that some optimisations to the model could be done, and it would seem that they should translate to reality fairly well.
I also exported the zma and imported it into speakerworkshop... the peaks are in the same relative places, but they are reversed in magnitude which is interesting...
Before I build I will measure the drivers again.. I think the measurements I have now are some I did in a hurry when I got the MW144's, so the drivers would have been well and truely broken in (5 years of music and Movies should do it)..
The other thing that is good about having done the model is that it does tend to indicate that the driver should drop in spl as freq increases as per the nearfiled measurement. I guess the driver naturally rolls off due to the VC inductance somewhat compensating what we would normally see as baffle step.
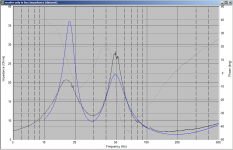
Anyway here are the latest graphs 🙂 It is interesting that the impedance peak at around 20Hz is much lower than the model suggests, and this is also the point where Terry pointed out a problem... could be leak related perhaps??
PS. I haven't been watching the news lately Terry, I take it there were floods in Adelaide! I'd heard about QLD but not SA. Hope you get everything back that you need.. If the stuff wasn't turned on, then washing in distilled water and leaving to dry before trying to start up is probably the best approach!
edit: I've added the screenshot of the model as well and just noticed the F3, This is definitely NOT what I originally modeled, I'm sure the F3 in the original model was around 40Hz or possibly a bit lower. So it looks like I stuffed up somewhere.
Oh and I forgot the ports are terminating too close to the back panel as well... probably only about 6cm clearance...
I averaged the two sets of T/S params and put them into unibox. Interestingly I needed to say the box had heavy fill to get it to give me the port length I have (and a 30Hz tuning). There is no stuffing in the box, but the lining (polyester) is a bit oversized and bulges a bit...
I chose to use the Le2 and re2 measurements in unibox and get it to model with those taken into account. apart from the falling off a cliff at 40Hz the real measurement follows the sim pretty closely. I certainly think that some optimisations to the model could be done, and it would seem that they should translate to reality fairly well.
I also exported the zma and imported it into speakerworkshop... the peaks are in the same relative places, but they are reversed in magnitude which is interesting...
Before I build I will measure the drivers again.. I think the measurements I have now are some I did in a hurry when I got the MW144's, so the drivers would have been well and truely broken in (5 years of music and Movies should do it)..
The other thing that is good about having done the model is that it does tend to indicate that the driver should drop in spl as freq increases as per the nearfiled measurement. I guess the driver naturally rolls off due to the VC inductance somewhat compensating what we would normally see as baffle step.
Anyway here are the latest graphs 🙂 It is interesting that the impedance peak at around 20Hz is much lower than the model suggests, and this is also the point where Terry pointed out a problem... could be leak related perhaps??
PS. I haven't been watching the news lately Terry, I take it there were floods in Adelaide! I'd heard about QLD but not SA. Hope you get everything back that you need.. If the stuff wasn't turned on, then washing in distilled water and leaving to dry before trying to start up is probably the best approach!
edit: I've added the screenshot of the model as well and just noticed the F3, This is definitely NOT what I originally modeled, I'm sure the F3 in the original model was around 40Hz or possibly a bit lower. So it looks like I stuffed up somewhere.
Attachments
Last edited:
I just recalled that the resolution of low frequency measurements can be increased by reducing the measurement sampling rate.
OK so it bugged me that the sim just didn't seem like something I would have done..... I changed the fill on the box to minimal and lo and behold the response plot looks much more like what I imagine I would have modeled!!! I think I should pull a lot of the lining out and re-measure to see what the difference is! I've read plenty of times that you can't stuff a reflex enclosure because it doesn't work and maybe I'm seeing that here.
Here is the comparison between the two sims, one with minimal fill and one with heavy fill. The one with heavy fill is a much better fit for the actual measured response. Just shows I should have measured these boxes years ago...
So either my lining is having a much bigger effect than just lining, OR the box is quite a bit bigger than what I think it is!
Tony.
edit: Oh yes I had forgotten that Shaun!! I've been sampling at 192Khz for these measurements! Only need probably 16K at most....
Attachments
Last edited:
See David Ralph's two-way build here for an in depth study about your problem.
SB Acoustics 2-Way Title Page
Hi David,
Just wondering how you adjusted the nearfiled curve for baffle step. I was thinking I could probably import the frd into speaker-workshop and make a filter that will simulate baffle step and then save the resulting curve as the adjusted frd.
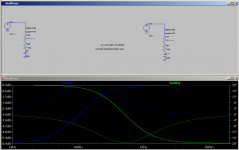
I just did a spice circuit based on the baffle step compensation I was planning on using for my active crossover, and using an inductor instead of the cap seems to give me the desired function (Blue trace).
I'm not sure about the phase though.... I guess I could import the modified and unmodified into excell and cut the phase from the unmodified and past it into the modified, or should I run with the modified phase as well???
Note that the spice sim does NOT have the correct components for this baffle width!
Tony.
Attachments
Please note that the coil in the above spice model was out by a factor of 10!
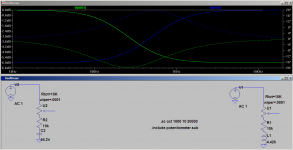
I've redone the spice model with the correct value cap and coil for my width baffle, and it looks much better 😉
I made a network in speakerworkshop the same as the one in spice and scaled the impeadance of the Driver up by 100K (the circuit needs at least 100K load impedance to work properly).
The result was interesting! The freq response flattened right out up to about 500Hz, wasn't what I was expecting but thinking about it, it makes sense. I won't need any BSC on the woofer as I will be crossing to the MTM's at 300Hz, so that is a valuable piece of info in itself. Also it would seem the woofers natural drop in levels (due to the voice-coil inductance) seems to compensate almost perfectly for the bafflestep rise.... or maybe I've just stuffed up again..... 🙄
I spliced to the 1.5M measurement at 400Hz and the result is shown on the holmimpulse screenshot. There is a bit of a phase issue (the corrected phase was closer than the non-corrected) note the step at 400Hz where I spliced. I tried putting in a -ve 4.4ms delay on the nearfield measurement to account for the difference between the 1.5M measurement and the nearfiled it made it match up at 500Hz but didn't make a lot of difference at 400Hz. Some more tinkering with that I think.
Certainly I think it is going in the right direction now though (though still could have made some mistakes).
I want to take some more measurements, without the lining, and also reducing the sample rate on the card. I used to measure at 16K sampling rate with speakerworkshop many moons ago for the woofer, but had forgotten that trick.... Holm only seems to let me go as low as 44.1Khz but that should give better resolution at low frequencies than 192Khz does.
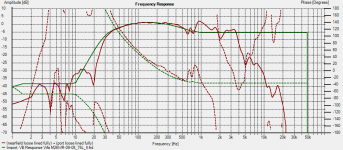
anyway attached is the comparison of the merged nearfield response before and after correction (blue trace before) with the correction circuit below it. Next is the spliced measurements in holm impulse. and finally the overlap of the adjusted nearfield and the 1.5M measurements. Final attachment is the spice model.
Tony.
I've redone the spice model with the correct value cap and coil for my width baffle, and it looks much better 😉
I made a network in speakerworkshop the same as the one in spice and scaled the impeadance of the Driver up by 100K (the circuit needs at least 100K load impedance to work properly).
The result was interesting! The freq response flattened right out up to about 500Hz, wasn't what I was expecting but thinking about it, it makes sense. I won't need any BSC on the woofer as I will be crossing to the MTM's at 300Hz, so that is a valuable piece of info in itself. Also it would seem the woofers natural drop in levels (due to the voice-coil inductance) seems to compensate almost perfectly for the bafflestep rise.... or maybe I've just stuffed up again..... 🙄
I spliced to the 1.5M measurement at 400Hz and the result is shown on the holmimpulse screenshot. There is a bit of a phase issue (the corrected phase was closer than the non-corrected) note the step at 400Hz where I spliced. I tried putting in a -ve 4.4ms delay on the nearfield measurement to account for the difference between the 1.5M measurement and the nearfiled it made it match up at 500Hz but didn't make a lot of difference at 400Hz. Some more tinkering with that I think.
Certainly I think it is going in the right direction now though (though still could have made some mistakes).
I want to take some more measurements, without the lining, and also reducing the sample rate on the card. I used to measure at 16K sampling rate with speakerworkshop many moons ago for the woofer, but had forgotten that trick.... Holm only seems to let me go as low as 44.1Khz but that should give better resolution at low frequencies than 192Khz does.
anyway attached is the comparison of the merged nearfield response before and after correction (blue trace before) with the correction circuit below it. Next is the spliced measurements in holm impulse. and finally the overlap of the adjusted nearfield and the 1.5M measurements. Final attachment is the spice model.
Tony.
Attachments
Last edited:
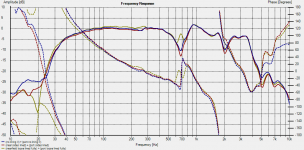
I got the measuring gear out again today and re-did the measurements. I did measurements with no lining, sides lined and fully lined.
Whilst there were differences, the measured response is still disappointing compared to the modelled response.
It would appear that the anomaly at 20Hz that Terry pointed out is caused by the loose fitting lining that covers the top, bottom and back wall. as the only measurement that shows it is when that is in place.
There are slight differences in all three measurements but the differences between sides lined only and no lining aren't very big. It may be that it is not so much the lining that is throwing out the tuning but perhaps the box volume is not what I think it is. I should dig up the plans for the boxes and work it out I guess!
I also took a measurement on the balcony of the MTM and got a very different result to the previous measurements! Not sure why but the treble is trailing off a lot! Apart from the environment for the measurement the other differences were I used my Playmaster amp (which I have noticed seems to sound less bright) and I took the measurement at a lot higher spl level, the other thing was the sampling rate was only 44.1K instead of 96K and previous measurements were done on the audigy sound card.
I unfortunately wasn't on the ball enough to take impedance measurements in each of the configurations...
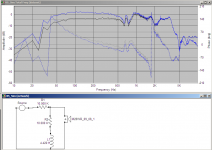
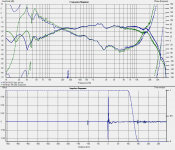
Images of today's measurements attached (the nearfield are 1/8th octave smoothed to make the curves a bit more distinguishable), first is compare of near-field with no lining, sides lined, and fully lined. second is the MTM measurement... Need to do some more investigations there as it doesn't look like previous ones!
edit: I used the formula that Terry gave me and it turns out that the adjustment for the ports is -8db nice and easy 🙂 also meant that I could do it all in Holm Impulse without having to export and import into speakerworkshop. also it should be apparent that the drop to 44.1Khz sampling has helped the resolution at lower frequencies too!
Tony.
Whilst there were differences, the measured response is still disappointing compared to the modelled response.
It would appear that the anomaly at 20Hz that Terry pointed out is caused by the loose fitting lining that covers the top, bottom and back wall. as the only measurement that shows it is when that is in place.
There are slight differences in all three measurements but the differences between sides lined only and no lining aren't very big. It may be that it is not so much the lining that is throwing out the tuning but perhaps the box volume is not what I think it is. I should dig up the plans for the boxes and work it out I guess!
I also took a measurement on the balcony of the MTM and got a very different result to the previous measurements! Not sure why but the treble is trailing off a lot! Apart from the environment for the measurement the other differences were I used my Playmaster amp (which I have noticed seems to sound less bright) and I took the measurement at a lot higher spl level, the other thing was the sampling rate was only 44.1K instead of 96K and previous measurements were done on the audigy sound card.
I unfortunately wasn't on the ball enough to take impedance measurements in each of the configurations...
Images of today's measurements attached (the nearfield are 1/8th octave smoothed to make the curves a bit more distinguishable), first is compare of near-field with no lining, sides lined, and fully lined. second is the MTM measurement... Need to do some more investigations there as it doesn't look like previous ones!
edit: I used the formula that Terry gave me and it turns out that the adjustment for the ports is -8db nice and easy 🙂 also meant that I could do it all in Holm Impulse without having to export and import into speakerworkshop. also it should be apparent that the drop to 44.1Khz sampling has helped the resolution at lower frequencies too!
Tony.
Attachments
Last edited:
I don't like it when I can't model something, so I went back to Unibox and had another try. I figured that the most likely other cause for the poor performance was the poor box construction causing leaks.
I remodelled manually dropping the leakage Ql in unibox to 1! The resulting sim whilst it didn't match the physical reality of my port lengths, did seem to follow the curve of the nearfield measurement of the woofer quite closely. Once port and woofer response are merged things don't look so close, trying to model the exact situation with leaks and their effect I think would be very difficult! I suspect things are complicated by the port placement which is too close to both the sides and back. It would seem that my attempts to seal the very poorly constructed box were not successful.
I'm starting to wonder whether I should bother trying to use these as are or just bite the bullet and do new cabinets... Certainly as are the will still provide a big bass boost over the MTM's however they are far from optimal.
Sorry this has drifted off track from the original post, but some (I think) useful stuff has come out of the input I got so figured I'd keep posting 🙂
I'm thinking of trying to merge a baffle step sim with the measured nearfield (I saw it mentioned in some google searches I did). As usual my attempt to get a simple measurement to finalise my crossover design has turned into an epic adventure 😉
Tony.
Attachments
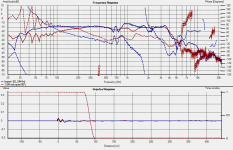
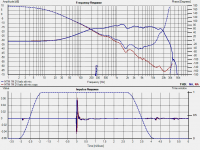
I've also gotten to the bottom of the high freq taking a dive. My measurement mic had gone nose first into the concrete one too many times 🙄. I hooked up an alternate mic to my mic boom and it was much better. The good news is it is only high frequencies (above 5K) that are affected so the sub measurements are fine...
Not sure why the sudden wiggles in the high freq's must be something to do with this new cards sampling at 96Khz was fine at 192Khz and 44.1Khz... strange...
anyway I think I have enough measurements now and hopefully a robust enough method of adjusting the nearfield to splice into the 1M measurement to get on with some more crossover modelling.
The blue trace in the graph below is with the alternate mic, much more like what I expected! BTW I can't hear past about 12Khz The tinitus I think drowns anything above that out.
Tony.
Attachments
Some of your HF hash looks like either a late reflection or some electrical interference. The bounce below 40 reminds me of a problem I had with Holm with DC offset on the input. I couldn't get rid of it without going to a sweep stimulus rather than an impulse.
On your previous curves I thought the correlation was decent. I have given up expecting an exact match between measurements and predicted response at LF. For best results in subwoofer tests I found that ground plane in a large warehouse was good, or mic inside the box (with 12 dB per octave filtering) was good. With suming nearfields you will always have a problem in that the port measurement has woofer breakthrough, the woofer measurement has port breakthrough.
Surprised by the amount of difference your box stuffing made?
David S.
Thanks David 🙂 Yes I was surprised by the amount of difference the box stuffing made (especially in that it wasn't supposed to be stuffing!) 🙂 It is probably a bit over 1" polyester batting.
I would like to try a groundplane measurement but it is a bit difficult logistically. Would probably need to get myself a USB soundcard and use the laptop.. could possibly use the carpark at work on a weekend, though an empty warehouse would be much better!
I have a feeling that the high freq hash might actually have come from the plants on the balcony I didn't bother moving them since I figured they were rather irregular and wouldn't present a hard surface for reflection. When I looked at the 44.1Khz measurement again it was there too. I'd have to do a measurement inside to work out if it is electrical or something in the new measuring environment... I'm a bit unhappy that my Audigy II ZS is not playing well with Windows 7, it never gave me any troubles. though the built in card gives a perfectly flat response in holm if I do a measurement with a loopback cable so it probably is environmental.. Overall there are much less reflections showing in the impulse from the outside measurement compared to the originals I did inside.
I'll have to try the mic inside the box trick it would certainly be easier than doing a groundplane measurement!
Tony.
After looking at the measurements again, I want to redo them all, sigh... There is something very odd going on down low as well, and when zooming in on the high frequency end there definitely seems to be an electrical type problem at the high frequencies, perhaps an oscillation in my amp..... though both the chipamp and the playmaster exhibited the same problem...
I also dug up the plans for the boxes and discovered that they are actually 75L cabs. Plugging that into the sim and setting the leakage to 2 gave an almost perfect correlation between the sim and the actual measured response, so I think I have some (BIG) leaks to track down... probably around the lpads on the back I suspect, which are no longer necessary so might just cover them up with some mdf...
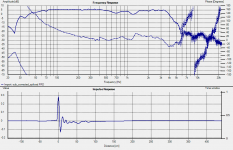
third image shows the high freq problem, note that it doesn't matter how short I set the gating the ripple is still there... I've got my audigy looking like it will work reliably now, so think I will have to do all the measurements again using it, as I've never had weird stuff like this before with it. I think my reservations about the on board sound card may have been justified...
Tony.
I also dug up the plans for the boxes and discovered that they are actually 75L cabs. Plugging that into the sim and setting the leakage to 2 gave an almost perfect correlation between the sim and the actual measured response, so I think I have some (BIG) leaks to track down... probably around the lpads on the back I suspect, which are no longer necessary so might just cover them up with some mdf...
third image shows the high freq problem, note that it doesn't matter how short I set the gating the ripple is still there... I've got my audigy looking like it will work reliably now, so think I will have to do all the measurements again using it, as I've never had weird stuff like this before with it. I think my reservations about the on board sound card may have been justified...
Tony.
Attachments

Last edited:
third image shows the high freq problem, note that it doesn't matter how short I set the gating the ripple is still there... I've got my audigy looking like it will work reliably now, so think I will have to do all the measurements again using it, as I've never had weird stuff like this before with it. I think my reservations about the on board sound card may have been justified...
Tony.
Periodic wiggle like that is most definitely a reflection in the measurement. (2nd impulse) The frequency of wiggle is related to the delay time so you might track it down that way. You don't have a measurement mic, plus a laptop mic running aat the same time do you? I did that once.
David S.
Hi David, I did the measurements on my desktop, with leads run to outside, however I do have a new webcam and the mic on that may not have been muted.... I'm not sure whether it could have got into the audio chain or not though, as in Holm Impulse you select the specific input... who knows what vodoo the on board sound cards mixer does though!!
Interesting thing is the period of that wiggle appears to be 357Hz which is pretty damn close to 1M (which was my Mic's distance from the speaker... the mic was 1.3M off the ground, and about 1.8M from the balcony roof. Distance to the next closest object would have been the plants on the balcony, which would have been a bit less than 1M but total path length from speaker to plants to mic would be over two meters... Distance to the webcam mic (through the screen door) would be about 3.5M...
Definitely something suspect happening... I've loaded some previous measurements of the same speaker, taken inside at 1M as well... the impulses look different but not incredibly so... BUT I've just found the problem 🙂 There is a spike at about -280 samples on the onboard sound card... some sort of pre impulse... Setting the gating to start after that completely removes the wiggles 🙂
Holm was setting the start to be -9600 samples, I guess the old trick of zero padding to get more resolution at low frequencies, only there weren't zeros where there was supposed to be!
Maybe I don't need to do those measurements again, especially since I think the nearfield adjustment seems to be working plausibly, so the low freq is not quite so important once I splice... 🙂
Thanks David you gave me the clue as to what to look for!!
Tony.
Attachments
One thing to consider. I've been using HOLM to measure my current system that is running through the Ultimate Equalizer. HOLM has a different window than I'm used to using, usually half-windows.BUT I've just found the problem 🙂 There is a spike at about -280 samples on the onboard sound card... some sort of pre impulse... Setting the gating to start after that completely removes the wiggles 🙂
Holm was setting the start to be -9600 samples, I guess the old trick of zero padding to get more resolution at low frequencies, only there weren't zeros where there was supposed to be!
If you have the setting in Data Analysis tab to be "Detect time zero" (I think it's the default), HOLM always resets the start for the beginning of the impulse data. You have to then uncheck the "From locked" setting in the options window each time. This was a help with the UE since it's running on a second PC and has a fair amount of latency.
After a bit of experimentation, I found that the best setting for the window start was, for my case, at -11 from peak. When set there, the individual driver slope measurements seemed to optimal.
If you're interested, I've got some additional HOLM measurements and info posted over here at the PE board.

I'd also suggest expanding the impulse to see the detail down to maybe maximum 4-5ms above the peak.
Once you've got a window that you prefer, go back to the Data Analysis tab and select "Time zero locked". Just be sure to reset it when done.
Dave
That should be -26 from peak.After a bit of experimentation, I found that the best setting for the window start was, for my case, at -11 from peak. When set there, the individual driver slope measurements seemed to optimal.
Dave
Thanks Dave! That is an amazingly flat freq response!!
I had forgotten about the time zero locked, I did it on my original measurements about 9 months ago, which showed that the woofers and tweeters in the MTM are indeed time aligned (as was the intention).... I think I need a checklist! work through till I get everything right, and right down all the things I need to do so in future I can just start measuring!
I've attached the full range, and expanded the gating window. Another thing I'm a little uncertain about is the Offset Samples setting. The blue trace is what Holm did by default, the phase looks completely wrong after about 2k I changed it slightly and the red trace is what resulted, whether it is right or not though I'm not really sure..... however I don't understand why the offset number is so high.. The blue trace has Offset [samples] as 19596.508 and the red has it as 19593.508 (basically three samples different), but why is it 19000 odd in the first place...
It was set to detect highest positive peak, I suspect I either need to invert the measurement or set to first peak..
Tony.
Attachments
Thanks, the credit for that goes primarily to the UE. If the raw measurements that are input are accurate, the output will be as well. It linearizes each driver individually for SPL and phase (if that is the selected option). BTW, this is without a loopback calibration in HOLM. All I did was use the mic cal file.Thanks Dave! That is an amazingly flat freq response!!
I've noticed that at times, but I attributed it to latency in the other PC, maybe it's not. I used detect first peak. A test with Causal Impulse looks to be an attempt to set it to the minimum-phase location for time zero. I haven't tried a lot of the options, just went for what I wanted from it.I had forgotten about the time zero locked, I did it on my original measurements about 9 months ago, which showed that the woofers and tweeters in the MTM are indeed time aligned (as was the intention).... I think I need a checklist! work through till I get everything right, and right down all the things I need to do so in future I can just start measuring!
If you change the horizontal time scale to sample points, click on Auto Detect again, then click Zoom Out, you'll see that the center setting of zero for the sample points is centered. At least that's what I see. The full time sample point setting will match the Signal Length setting (Device and Signal) with zero at the center (+/- 1/2 the length setting). This appears to provide a method of windowing for time before zero. I'm not really sure how one would use this. The offset that you see is the sample point offset from time zero. Remember that this is relative time zero. The offset is the number of sample points beyond the sample point zero as shown when set as "Impulse as samples".I've attached the full range, and expanded the gating window. Another thing I'm a little uncertain about is the Offset Samples setting. The blue trace is what Holm did by default, the phase looks completely wrong after about 2k I changed it slightly and the red trace is what resulted, whether it is right or not though I'm not really sure..... however I don't understand why the offset number is so high.. The blue trace has Offset [samples] as 19596.508 and the red has it as 19593.508 (basically three samples different), but why is it 19000 odd in the first place...
First peak worked for me, along with Interpolate samples (not really necessary most of the time). I liked it because it helped to show just how linear the phase is from the UE when it EQ's phase.It was set to detect highest positive peak, I suspect I either need to invert the measurement or set to first peak..
I'm going to have to experiment some more, it's got interesting options that may prove useful later.
Dave
p.s. If you click "Auto detect" two times successively, it always seems to shift maybe 2 time samples the first time. All subsequent ones result in no change. Kind of looks like a small but to me.
Last edited:
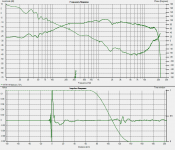
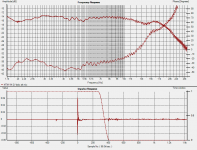
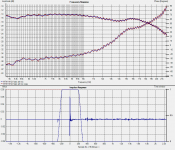
Hi Terry, Here is the impedance plot warts and all (more evidence of need of improvement) 😉
From the look of it the box is tuned to 30Hz. I thought it was 34Hz from memory but I'd have to simulate to find out. The box is nominally 70L. Just looked at the T/S params and there are some differences between the two drivers and I don't know which is which... will average them and do a model.
I made the new baffles (on existing boxes) for these drivers probably 10 years ago not really sure when it was.... was the first excercise I did in modelling and "real" speaker construction, so I'm not sure what was going through my head, but I do remember deviating from a maximally flat response to try and get an extended response, which doesn't look to have been successful 😉
Tony.
Does distorted graph attached with this post say the enclosure has lot of leakage ? cause i had experienced this sometimes back.
I don't know Aucosticraft! It could well be (often wiggles in the impedance plot are reflections or resonances, and I would imagine these boxes would show a number of these as well)... I guess if I track down the leaks and get it performing how it should then a new impedance plot will give the answer... I tried to look for leaks last night playing 30 hz and using a canldle around the box but couldn't find anything...
Dave, I had a bit of a play with the auto-detect. it seems it always chooses the centre of the peak as time zero. It seemed however that the phase response looked more normal when I manually adjusted to have the impulse signal start to rise from time zero... I guess it doesn't really matter provided both drivers being modelled for crossover have the same method applied...
Tony.
Last edited:
- Status
- Not open for further replies.
- Home
- Loudspeakers
- Multi-Way
- splicing nearfield to farfield, does this look right?