Hello!
I do see here quite regularly threads about diffraction but, respectfully, I have the impression that sometimes there is not enough understanding about diffractions. I am no expert either but I spent quite some time researching and simulating on this matter and I think I can share some thoughts which may be helpful.
I don
’t want this thread to be about the fundamental physical background of diffractions, I don
’t want it to be about the design of a specific cabinet and I also don
’t aim to make a new tool to calculate diffractions. There are already plenty.
Instead it should be about a general understanding of cause and effect regarding diffractions. I want to describe what can be expected from different measures to tame diffractions for proper sound reproduction.
I already have to apologize here because this will become quite a wall of text but at least there will be some pictures.
How to calculate diffractions
For a better understanding I think it
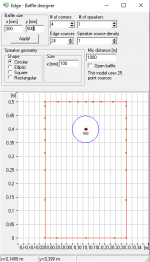
’s best to start to explain how software like The Edge simulates diffractions. I am not affiliated with the software in any way so I can
’t say anything about the details, only how this works in general. The input for such a simulation may look like this.
For each point at the edge of the baffle the software calculates the distance (Source
–> Point at the baffle
–> microphone) minus (Source
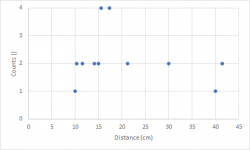
–> microphone). For now, all my calculations will assume that the microphone is in infinite distance directly in front of the chassis. When doing exactly the same calculation in Excel, I get the following values as a function of the angle. I will call the result from this calculation
“distance
” from now on. 0
° in this case is the perpendicular distance to the left edge and then every 15
° there is another point at the edge in clockwise direction. It is quite easy to follow. The first 3 points are located at the left edge, each with slightly increasing distances, the next points are on top, which first decrease in distance until a distance of 10 cm is reached, representing the perpendicular distance to the top edge and so on. At an angle of about 270
° three distances stand out representing the three points at the bottom edge.
This plot can now be rearranged, because for diffractions it does not matter under which angle which distance is obtained. Only the distances themselves matter. For symmetry reasons some of the distances are the same and they can then be summarized. For example, 15
°, 165
°, 195
° and 345
° all give 15.53 cm. To ease further calculations, I can group these 4 to a single data point with a higher weighted impact on the overall diffraction pattern. I do the same for all similar distances and get then the following graph.
Now the effect for each of these groups of distances on the acoustic frequency response has to be calculated. Each of these groups of distances will produce a single sinus shaped deviation from a flat frequency response. For a visual representation please look at the pictures shown here
Diffraction from baffle edges. When looking at the 12
” cylindrical baffle in this link, you can clearly spot the sinus curve. When looking at the other pictures, you can also immediately spot that larger baffles give a higher frequent sinus curve in the diffraction pattern.
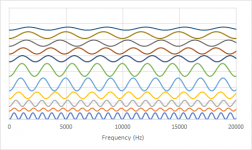
In the next step I calculate a sinus curve for each spot in the graph. I have to consider three things:
1. All curves have to have a minimum at 0 Hz,
2. the frequency is dependent on the distance and the speed of sound and
3. The amplitude is dependent on the abundance of each distance (= count). When calculating all these sinus curves individually, it will look like this. The sinus curve at the very bottom originates from the highest distance (41.41 cm).
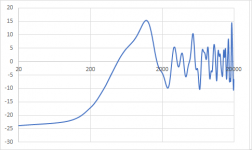
Now this is audio and it a common convention to plot the frequency axis not linearly but logarithmically.
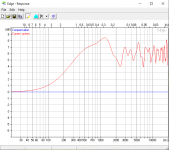
The total diffraction pattern can be seen when adding the curves.
Now the scaling is a bit off. The x-axis is already fine since I considered the speed the sound when calculating Hz from cm but the y-axis is not. To fix this I have to discuss what this graph represents. To my understanding, this represents the additional sound pressure due to the half of the spherical wave which nominally is propagating to the back but is immediately reflected to the front due to the baffle, assuming an ideal point source and ideal reflectivity of the baffle. Since I used 24 points and calculated sinus curves ranging from -1 to 1 for each, the sum of them can now range from -24 to 24. -24 represents no reflection to the front (= just direct sound) whereas 24 represents full reflection to the front (= doubled sound pressure). By rescaling the reflections to range from 0 to 1 and adding the sound pressure from the direct sound, which is 1, I can calculate the sound pressure
level increase when using just direct sound pressure as a reference.
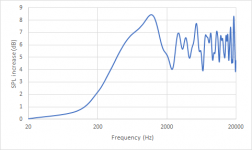
Nevertheless, it seems I am wrong on this one and if someone can explain my mistake to me, I would be grateful. For a calculation giving the same results as The Edge I have to scale the reflected sound pressure to range from
0 to 2, meaning that the reflected sound pressure can be twice as high as the direct sound pressure. With this value I then do the same as previously described: I add 1 for the direct sound and calculate the sound pressure level using the direct sound pressure as reference.
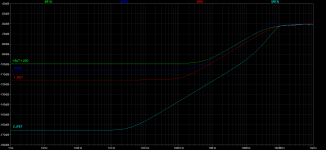
This then gives this plot, which looks very much like the result from The Edge.


 Thread split from here -
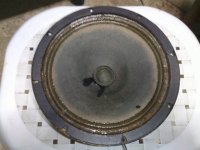
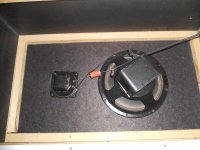
  ) but turning the driver through 180deg did not help.


