And to answer your question, Scott "Why three bins?" it's because the frequency isn't stable. I was able to make a wildly unstable signal, like an LP with the hole far off center, and it landed in multiple bins. Even a perfect tone right at the bin frequency spreads a little, depending on windowing and things.
You know that, of course, but it did look odd on my graphs. Just part of vinyl playback.
You know that, of course, but it did look odd on my graphs. Just part of vinyl playback.
Blink and you miss it on this threadSorry guys I have not been following along the last couple of days. The plot shown is for instantaneous frequency only, right? I'm possibly confused around the discussion of instantaneous amplitude. I'm assuming that's a third dimension sort of like a plot of the analytic signal.
")
Yes. We wish to be as precise and confident as possible in saying that outcome of the Shure before/after 150 play tests showed no meaningful differences, except for about +2dB increase in 2nd harmonic distortion for much of the audioband. So explaining how potential effects of FM/pitch stability on test tone measurement was taken care of is where we were at.
The radial plot is for part of the test suite George kindly recorded: a long 3150Hz tone designed to facilitate wow & flutter testing. So not strictly a part of the before/after 150 play tests, other than to allow us to examine FM/pitch stability for the Shure rig, which is good method anyway.
Happy to run those other radial FM plots for you, George, but the second link seems dead - would you please repost? I'll PM you when they're done, rather than distract the thread. I wrote this tool for myself a few years back, don't mind running a few every now and then.
LD
Last edited:
Yes, pragmatically even with 128 point FFTs I used multiple bins. Partly because, as you say, test tone frequency doesn't necessarily tally with centre of a bin, and partly to accommodate real signals FM spread. This is fine and sensible, of course.And to answer your question, Scott "Why three bins?" it's because the frequency isn't stable. I was able to make a wildly unstable signal, like an LP with the hole far off center, and it landed in multiple bins. Even a perfect tone right at the bin frequency spreads a little, depending on windowing and things.
LD
Last edited:
Yes it does.
Thank you very much Lucky for taking the time to explain and illustrate.
The flattening of the circle btn 4 and 7 o’clock shown by the diagram is something I notice with the in build stroboscope in this Kenwood KD-3100 turntable .
I have been given two Kenwood KD-3100 units and they show exactly the same platter rev instability. The Kenwood is not the TT I use for playing music though.
I'll have to download the manual for that and see how it compares motor wise with my KD-550, which was going to be the mono-rig* but now I have more things I want to play with on it. When I finally get a test record with the right tones on it will take a recording to compare. My bearing was nearly dry after 30 years, I wonder if you might have a similar issue. Will report back.
*The bin at the village green was full of records after the car boot sale 2 weekends ago. A lot of dross but I got some interesting mono Deccas out if in the 20 max that my good lady allowed me to bring back.
George: Nope yours is a pancake motor. Shame that as on paper pancakes should provide a smoother drive. I have a pioneer PL-200 I got for experimenting with to test that theory. one day.
(pertinent as there is an argument that any motor cogging/torque ripple could create or sustain a LF resonant mode. I know its low order but nonetheless one to consider).
(pertinent as there is an argument that any motor cogging/torque ripple could create or sustain a LF resonant mode. I know its low order but nonetheless one to consider).
Yes, pragmatically even with 128 point FFTs I used multiple bins.
This is the source of my confusion, are the short FFT's for determining the instantaneous frequency, amplitude, or both?
I can't see good frequency resolution with the short FFT, but amplitude works well.
Don't understand how Lucky is doing it.
OK, that makes sense. I downloaded one of George's files and will try some classic Hilbert transform stuff on it.
Avoiding confusion, we are talking about my polar plot 'instantaneous frequency' pitch stability software, of course. Which has good frequency resolution and precision because that's what it's designed for. Essentially, at its core it's a precision FM demodulator, and being FM, it cares not about amplitude of the test tone over a very wide range.I can't see good frequency resolution with the short FFT, but amplitude works well.
Don't understand how Lucky is doing it.
Yes it uses very short FFTs in places, and yes that's counter-intuitive, but the cute bit is the frequency detector, which I'm still very pleased with.
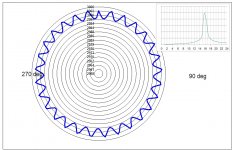
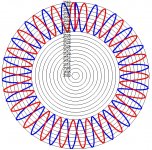
Attached are some old calibration plots, including in band AM rejection, adjacent frequency noise rejection, etc. And one showing real world shaft vibration for both the polar plot and conventional spectrum.
LD
Attachments
Last edited:
Happy to run those other radial FM plots for you, George, but the second link seems dead - would you please repost? I'll PM you when they're done, rather than distract the thread. I wrote this tool for myself a few years back, don't mind running a few every now and then.
LD
Thank you Lucky.
Here is the new link for the recording from the JVC turntable
https://www.dropbox.com/s/47yit4qqc... M97xE 1.5gr UAT S1T10 W&F declicked.wav?dl=0
Re PMing
I don’t mind of public exposure on such matters. A bit of ridicule is good in setting me straight
I think it would be nice if there was a tread where such W & F related plots from various turntables were uploaded. Ideally, all should be made from reading the same test track, as the frequency stability of the test track itself is a great part of the picture but this is too much for practical reasons.
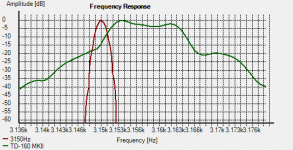
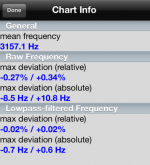
Michael thank you very much.the TD-160 spreads from 3152 to 3162 Hz.
That spread equals to 0.3% (or +/- 0.15%). I guess it’s much, although I don’t know if that figure can be compared with the specified 0.06% W & F for that turntable (DIN 45507 weighted)
George
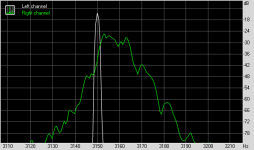
That's what I found and that's what I wondered. The FFT plot seems to show high W & F. But is it an accurate measure? I analyzed 1.8 seconds but can't tell if the variation is wow or flutter, or how much of both. Lucky's polar plot would tell you that.That spread equals to 0.3% (or +/- 0.15%). I guess it’s much, although I don’t know if that figure can be compared with the specified 0.06% W & F for that turntable (DIN 45507 weighted)
That's an important part, for sure. Also, how stable is the ADC clock. Very stable, one would hope, but we don't know exactly....the frequency stability of the test track itself is a great part of the picture ...
Anyhow, I have yet to see any resonances that Bill is looking for in these MMs, unless it's the little blip at the top of FR. A sweep should best show the resonance, but I don't have the tools to see it in a prerecorded sweep.
I forgot that I have the Platter Speed app on my phone. Played it your TD-160 file and the results are below. It was playing a little fast. The low pass speed variation looks within spec. It is low passed for this reason:
Because the frequency fluctuates somewhat with each single turn of the record, the fast components of the frequency chart are filtered to eliminate the influence of the record’s excentricity. What remains is the (relatively) long term deviation of the frequency which is mainly caused by the record player.
Attachments
LD,
A small addition to your perfect explanation: when using a 128 point FFT on samples taken at 96Khz, the time slice is ca 1msec giving a filter bin width of ca 10Hz. So for a 1 sec recording, a 128 points FFT means averaging 1000 time slices with no overlap, and 2 to 3 times as much with overlap, where overlapping is to be preferred in combination with some window function.
The resulting 10Hz filter width, or +/- 5Hz should help to include FM products caused by TT and Cart that are "absorbing" energy from the main lobe, and depends on the window function being used. Since the arm/cart resonance is at roughly 10Hz, even a shorter FFT could have been used, or bins could have been merged together after the FFT calculation.
Hans
A silly mistake from my side in the above posting. A 128 point FFT from samples taken at 96Khz gives a time slice of ca 1msec, so far so good, but the filter width is in that case not ca 10Hz, but 750Hz. For a filter width of 12 Hz you will need a 8192 point FFT.
In #1237 Pano mentioned that both FFT length's gave the same result in peak amplitude, which makes sense altogether.
Hans

OK George, since you ask for it...........Thank you Lucky.
Here is the new link for the recording from the JVC turntable
https://www.dropbox.com/s/47yit4qqc... M97xE 1.5gr UAT S1T10 W&F declicked.wav?dl=0
Re PMing
I don’t mind of public exposure on such matters. A bit of ridicule is good in setting me straight
I think it would be nice if there was a tread where such W & F related plots from various turntables were uploaded. Ideally, all should be made from reading the same test track, as the frequency stability of the test track itself is a great part of the picture but this is too much for practical reasons.
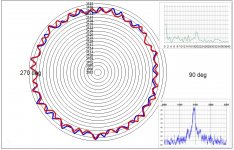
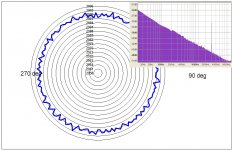
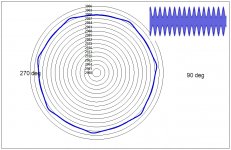
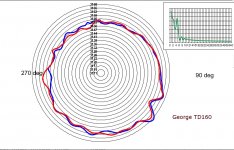
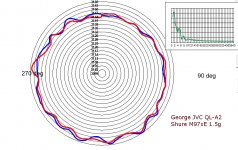
Here's two polar plots, one each for your TD160 + SME3009i + DL103, and the JVC QL-A2 +M97eX.
I hope they're self explanatory: once around the polar plot is one platter revolution, radius is 'instantaneous frequency', and red and blue lines are two successive revolutions. Inset is the spectrum of FM modulation, x axis in Hz.
Overall the TD160 result tallies with Pano's spectrum/ Dr F tests: a deviation of about +/- 0.35% over the revolution. You can see, much of this is a once per revolution eccentricity type deviation, perhaps from eccentricity of the record or the spindle shaft, or vertical platter run-out. There's also a once per platter event at about 4 o'clock, which seems to have spectral content about 4Hz which might be warp, but doesn't show up when the same record was used on the JVC, so probably not.
I would say from experience that the TD160 rig, overall, is below par as to pitch stability, but not untypical of untreated TTs. One radial line on the polar plot is about my limit of audibily, that's fairly normal AFAIK. A suitable case for improvement.
The JVC QL-A2+M97 plot is a bit better, especially as to once per revolution deviation. But there looks like twice per revolution stuff going on in the spectrum, plus something about 5 Hz, and what might be the cart-arm resonance at about 7 or 8Hz beneath all the other stuff. Overall, another suitable case for improvement, IMO !
Yes, I'd contribute to a separate thread on exploring the true nature of pitch stability in vinyl playback. But, be advised, there's a lot more myths waiting to be busted, which as we know isn't exactly ever popular.........
LD
Attachments
Last edited:
Nice work, Lucky - thanks. It's an interesting way to look a this, not the least because the plot actually looks like a record.
This raises several questions for me.
Overall the TD160 result tallies with Pano's spectrum/ Dr F tests: a deviation of about +/- 0.35% over the revolution. You can see, much of this is a once per revolution eccentricity type deviation, perhaps from eccentricity of the record or the spindle shaft, or vertical platter run-out. There's also a once per platter event at about 4 o'clock, which seems to have spectral content about 4Hz which might be warp, but doesn't show up when the same record was used on the JVC, so probably not.
This raises several questions for me.
- Is it possible to see the polar results in percentage, instead of frequency? That might be a little easier to grasp, along with your comments that one division is usually audible.
- Can you change the scale?
- Do eccentricity and warp show up the same way on your plot? Can you tell them apart?
- What do you think of the low pass approach used by Feickert?
- Home
- Source & Line
- Analogue Source
- mechanical resonance in MMs