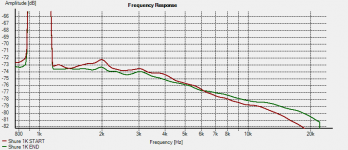
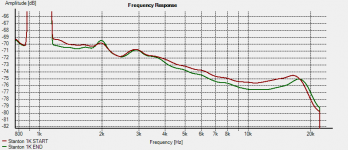
FWIW, my findings on noise are inconclusive. See below noise from the 1K track from the beginning plays to the end plays. These are 1/6th octave smoothed, to better show the amplitude. Shure on one graph, Stanton on another.
NOTE: The Stanton's output is 4.5dB higher than the Shure. Graphs not normalized.
NOTE: The Stanton's output is 4.5dB higher than the Shure. Graphs not normalized.
Attachments
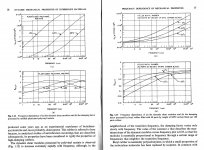
I've alluded previously to the dependency of mechanical impedance of elastomers on both temperature and excitation frequency. Perhaps pertinent (or not) to the present discussion I've (hopefully!) attached a scan of two pages from J. C. Snowden's text "Vibration and Shock in Damped Mechanical Systems". The r.h. page is for one specific butyl rubber compound which seems typical of elastomers used for stylus cantilever bearings. The top curves relate to stylus compliance, the bottom ones to damping.
Could it be that extended play of high-modulations increases bearing temperature such that its mechanical properties are significantly affected? Note that both Shure and Stanton styli have a metal tie wire providing a thermal path from cantilever to outer case.
Could it be that extended play of high-modulations increases bearing temperature such that its mechanical properties are significantly affected? Note that both Shure and Stanton styli have a metal tie wire providing a thermal path from cantilever to outer case.
Attachments
Here are the “Shure Start” and “Shure End” recordings sectioned into their 27 individual frequency sections.
Sectioned files are also manually declicked.
Shure Start
https://www.dropbox.com/sh/ixbtok0sw10fmpo/AAC2FOoBL_x9RPYNKHeVTbGta?dl=0
Shure End
https://www.dropbox.com/sh/86wdcaxc7k3ptpb/AAABRrJb8Qmkmmbf8FMiILqXa?dl=0
George
Sectioned files are also manually declicked.
Shure Start
https://www.dropbox.com/sh/ixbtok0sw10fmpo/AAC2FOoBL_x9RPYNKHeVTbGta?dl=0
Shure End
https://www.dropbox.com/sh/86wdcaxc7k3ptpb/AAABRrJb8Qmkmmbf8FMiILqXa?dl=0
George
Here's the first results of analysis of the Shure before/after tests, with 150 plays on the Stanton cartridge in between.
I analysed George's complete sectioned files, thank you George, using a short FFT (128/512 bits) and integrating energy within the system of spectral peaks of the test tone and its harmonics: this takes care of errors due to FM of the original test tone, as outlined previously.
Differences between before/after 150 Stanton cartridge 2.5g plays, Shure cartridge for before/after playback. Estimated error limits +/- 0.2dB 2 sigma. Negative means 'after' is smaller than 'before'.
1KHz : Fundamental: +0.13dB; 2nd: +1.58dB; 3rd: -0.05dB
5kHz : Fundamental: +0.20dB; 2nd: +2.24dB; 3rd: -0.19dB
10kHz: Fundamental: -0.04dB; 2nd: +2.37dB; 3rd: +1.94dB
20kHz: Fundamental: -0.07dB; 2nd: -0.74dB;
Relative levels of harmonics to test tone are (after):
1kHz : 2nd -37dB; 3rd -39dB
5kHz : 2nd -27dB; 3rd -34dB
10kHz: 2nd -20dB; 3rd -37dB
20kHz: 2nd -28dB
Anecdotally, there was no meaningful difference in audioband noise floor 'before/after' for these file sections, about +/- 0.1 dB or so.
From these results, one can reasonably infer there was no significant change between the before/after tests, except for 2nd harmonic distortion which increased by about 2dB for the after test versus the before, consistently across the 1kHz to 10kHz frequency range, but was not observed at 20kHz, rather a decrease of about 1dB. However, the base level for 2nd harmonic distortion, about -27dB at 5kHz, means such effect is very probably inaudible in any event, IMO. For practical purposes there was no meaningful change between the before/after tests IMO.
Interesting ?
LD
Last edited:
Thank you Lucky.
Meaningful analysis and reasonable conclusion.

For educational purposes, if you are willing to and when you find the time, can you please explain in detail how you did this?
George
Meaningful analysis and reasonable conclusion.
using a short FFT (128/512 bits) and integrating energy within the system of spectral peaks of the test tone and its harmonics:
For educational purposes, if you are willing to and when you find the time, can you please explain in detail how you did this?
George
")
Thanks Lucky. That was also my conclusion, using different analysis methods. No significant change, except little in H2. Noise didn't change, HF content didn't change, distortion changed only a tiny bit.For practical purposes there was no meaningful change between the before/after tests IMO.
It seems that with a good phono system, and perhaps a quality slab of vinyl, record wear just isn't an issue. Where does this leave us with all the tales we've read over the decades - that only the very first play is top quality, and that it goes down hill fast after that?
For sure, I'll try George, though no doubt many can explain it better......For educational purposes, if you are willing to and when you find the time, can you please explain in detail how you did this?
Firstly, the problem we are trying to overcome is how to accurately report the level of a monotonic test tone in vinyl playback. Although it is monotonic, there is FM from several sources which varies the exact frequency from moment to moment and so spreads the 'energy' of the test tone across a range of 'bins' in a high resolution FFT.
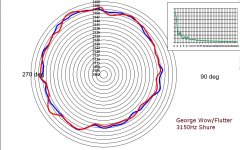
Attached is a plot that illustrates how FM varies instantaneous pitch for the Wow & Flutter test tone you recorded as part of this suite, George. Once around the plot is one revolution of the platter, the radius is 'instantaneous frequency', red and blue lines are successive revolutions. Inset is a spectral analysis of the FM modulation: in this case it's mostly eccentricity plus some stuff at about 4Hz (warp?) and a few other spots, but the cart-arm resonance appears quite stable IME. Overall, this fairly typical of a normal/good playback system, IME.
High resolution spectrum analysis will always show a distribution of level by frequency around 3150Hz, whose peak level will depend upon amount of FM (pitch variation) present. So, to find the true level of the test tone we need to sum or integrate level of all FFT bins within a range, rather than take peak level of the range.
In the case at hand, we're not interested in frequency resolution, since we already know the monotonic frequency. So a short length fourier transform, having lower frequency resolution, is convenient for automatically integrating the range of frequencies affected by FM. And, requiring shorter time slices, has advantages in noise, artefacts and averaging, given the 1s or so samples.
So it's just a matter of choosing minimum sufficient resolution to conveniently 'bin' the range of frequencies we're interested in and reject the out of band stuff we're not. Something like Audacity will allow a minimum 128bit length, which is fine. Also, this way there are 100's of time slices within our 1s data sample, rather than just one or two with 64k/32k bit lengths.
Hope this makes sense.......!
LD
Attachments
Last edited:
LD,
A small addition to your perfect explanation: when using a 128 point FFT on samples taken at 96Khz, the time slice is ca 1msec giving a filter bin width of ca 10Hz. So for a 1 sec recording, a 128 points FFT means averaging 1000 time slices with no overlap, and 2 to 3 times as much with overlap, where overlapping is to be preferred in combination with some window function.
The resulting 10Hz filter width, or +/- 5Hz should help to include FM products caused by TT and Cart that are "absorbing" energy from the main lobe, and depends on the window function being used. Since the arm/cart resonance is at roughly 10Hz, even a shorter FFT could have been used, or bins could have been merged together after the FFT calculation.
It would be interesting to see what differences it makes when using even shorter FFT's. When you can point me in the direction of a few representative time slices that George has recorded, I will do the calculations for different FFT length's and show what the differences are.
When trying to come to satistical relevant conclusions, the base figures should be as reliable as possible
Hans
Although it is monotonic, there is FM from several sources which varies the exact frequency from moment to moment and so spreads the 'energy' of the test tone across a range of 'bins' in a high resolution FFT.
High resolution spectrum analysis will always show a distribution of level by frequency around 3150Hz, whose peak level will depend upon amount of FM (pitch variation) present. So, to find the true level of the test tone we need to sum or integrate level of all FFT bins within a range, rather than take peak level of the range.
So it's just a matter of choosing minimum sufficient resolution to conveniently 'bin' the range of frequencies we're interested in and reject the out of band stuff we're not. Something like Audacity will allow a minimum 128bit length, which is fine.
OK, I had to think about this, run some analysis, generate some files and investigate. I understand about the small number of bins doing a better average, but how much better than peak with 65K bins? Turns out, it depends.
The 5K tone from George's recordings doesn't fall directly into a bin at 128 or 65K bins. Neither does a computer generated sine of 5K. In either case, the value reported in the 5250 bin (128) or the 5033.203125 (65K) bin are different by ~3dB. With a stable, computer generated tone, they are equivalent. The wow and flutter is better integrated by fewer bins. With a pure tone it doesn't matter.
When a 5K tone with heavy frequency modulation (46kHz to 54kHz) Hz is analyzed, the 65K FFT peak is spread over many bins, with each bin showing a level 25dB below the actual value. 128 bins does better in this extreme case, the peak bin just 1dB lower than the real value.
With an unstable signal, like an LP, a low number of bins does a great job of showing actual levels. With a pure tone, it's doesn't make much, if any, difference.
Hope this makes sense.......!
LD
Yes it does.
Thank you very much Lucky for taking the time to explain and illustrate.
The flattening of the circle btn 4 and 7 o’clock shown by the diagram is something I notice with the in build stroboscope in this Kenwood KD-3100 turntable .
I have been given two Kenwood KD-3100 units and they show exactly the same platter rev instability. The Kenwood is not the TT I use for playing music though.
If you’ll have some free time in the future to run the W & F analysis on these two files I link to, I’d love to see the polar plot of them.
The first is from my Thorens TD-160MKII (modded) + SME 3009 Imp (modded) + Denon DL-103 (modded, RIP)
https://www.dropbox.com/s/s0glnf3n02s335f/TD160 %2BSME3009Imp%2BDL-103-UAT%20S1%20T10 %20W%26F%20declicked.wav?dl=0
The other is from a JVC QL-A2 which I consider a very descent low price TT. It belongs to a friend. The recording is with the Shure M97xE
https://www.dropbox.com/s/zrmwofkplxx74ha/JVC% 20QL-A2%20%2B%20Shure%20M97xE%201.5gr% 20UAT%20S1T10%20W%26F%20declicked.wav?d l=0
George
Sorry guys I have not been following along the last couple of days. The plot shown is for instantaneous frequency only, right? I'm possibly confused around the discussion of instantaneous amplitude. I'm assuming that's a third dimension sort of like a plot of the analytic signal.
- Home
- Source & Line
- Analogue Source
- mechanical resonance in MMs