Thanks Bill, that's great. But I'd rather not link to whatever might remain on another forum, if that's OK? I doubt that will detract....... thxI'll open a thread tonight and try and link in what little survived the purge.
LD
Nice work, Lucky - thanks. It's an interesting way to look a this, not the least because the plot actually looks like a record.
Lucky what's the scale on the inset plot? Is it orders or frequency. By orders I mean as in machine design where once around is 1.
Re: frequency stability of test records. I posted a picture a while back with a quick computation that showed on a a mistracking test the grooves had to interleave perfectly from one revolution to the next. This was obvious under my little USB microscope. The same could be done at 3150 Hz which is exactly 1750 cycles per revolution so conceivably the lathe could be taken out of the equation via a visual analysis of the grooves.
The inset is intended to provide a spectrum view of whatever is FM modulating the test tone. It's just the result of an FFT of the demodulator output, sampled around the revolution. The y axis is auto-scale-to-fit linear level of demod output. For the purpose of identifying contributing sources that's fine. And the x axis is simply modulating frequency in Hz.Lucky what's the scale on the inset plot? Is it orders or frequency. By orders I mean as in machine design where once around is 1.
In the scheme of things, the FM modulating action is all at low frequencies, one can see that a number of ways. There's no energy for it to be otherwise, when you think about it....... but hey, that's for another thread !
LD
Thanks, Pano.This raises several questions for me.
I agree with Bill that a thread on platter speed and stability using some of the techniques shown here would be most interesting.
- Is it possible to see the polar results in percentage, instead of frequency? That might be a little easier to grasp, along with your comments that one division is usually audible.
- Can you change the scale?
- Do eccentricity and warp show up the same way on your plot? Can you tell them apart?
- What do you think of the low pass approach used by Feickert?
Radial lines are close enough to 0.1% pitch variation, said to be about the threshold of audibility. So keep it in the tramlines and all is good IME.
Record warp and eccentricity rarely show the same profile IME: warp is seldom uniform, and typically 'pinched', whereas eccentricity is uniform. Vertical platter run-out or spindle vertical misalignment can mimic eccentricity.
I don't know much about Dr F's low pass approach, but assuming it rejects LF there isn't much FM left IME, which seems to tally.
LD
Thanks Bill, that's good. I was just a pup back then. And besides, technical editing with a blunt instrument is just scaryNP. It was just the introductory stuff and some posts on the maths behind it I was thinking of. But fresh start it is
LD
Last edited:
AFAIK we're about the same age Bill!You were older then than I am now
And I don't mean that your technical editing might be blunt, just that whatever's left might have already suffered that fate, I fear. Best just to move on, I think
LD
The Low-Z board uses 1642s in the servo. One per board. Gimmie another 48 hours to confirm bits with Hans. Nearly there!
LD: My apologies. It's your extensive Decca mono collection that threw me. It's easy to forget that there are other under 50s on this forum sometimes.
LD: My apologies. It's your extensive Decca mono collection that threw me. It's easy to forget that there are other under 50s on this forum sometimes
.I'm resisting joining the W&F discussion as I still haven't got round to doing the simple (??!!) frequency response stuff but if I may put on my pseudo FFT guru hat on ..But is it an accurate measure? I analyzed 1.8 seconds but can't tell if the variation is wow or flutter, or how much of both. Lucky's polar plot would tell you that.
Larger FFTs reduce the 'noise' floor and with the finer frequency resolution allow you to more accurately determine the 'limits' of the 3150Hz modulation.
If you want to accurately determine level, you should use a large FFT (fine frequency resolution) and sum the 'energy' in your carefully chosen bins.
The tone has sidebands (which includes the FM 'noise' widening that people report) but these are EXACTLY what you are looking for. If you shift the Frequency record so that 3150 becomes 0Hz, the spectrum is then your W&F and you can apply DIN and/or other weighting to get whatever measurement you like. I suspect lucky is doing something similar when he 'FM demodulates'.
The spectrum of the sidebands tells you what is responsible ... see lucky's examples and spectrums.
Does including the sidebands make determining the 'amplitude inaccurate'?
Yes but you can't disassociate the sidebands from the tone and you have exactly the same problem whatever method you use.
Using a smaller FFT just hides the problem .. but if you just want a crude 'number', this might be as good as any.
...the frequency stability of the test track itself is a great part of the picture ...
I doubt if the stability of the original tone or the ADCs are anywhere near the instability of vinyl playback. I remember hearing a low distortion, really frequency stable sine wave for the first time and being totally amazed. At that time the 'purest' sine waves I was using was from the Radford LDO.That's an important part, for sure. Also, how stable is the ADC clock. Very stable, one would hope, but we don't know exactly.
Anyhow, I have yet to see any resonances that Bill is looking for in these MMs, unless it's the little blip at the top of FR. A sweep should best show the resonance, but I don't have the tools to see it in a prerecorded sweep.
If we are after HF resonances above 20kHz, we will have to re-think how to do this and/or find the B&K test record which IIRC went up to 50kHz.
No, I genuinely detect very precise frequency, about 1 or 2 ppm measured on synthetic tones IIRC, and necessarily must use short FFTs for good time resolution.I suspect lucky is doing something similar when he 'FM demodulates'.
There's a cute way of doing this which any FFT guru will surely already know..........
The spectrum inset graph is genuinely simply an FFT of FM demodulated deviation: the spectrum of whatever is FM modulating the test tone.
LD
Great, and no apology needed ! Yes, I do love Decca LXT monos and SXLs. It was a Decca mono that originally got me into exploring how to get the most from playback; I was amazed by a 1952 recording/pressing.The Low-Z board uses 1642s in the servo. One per board. Gimmie another 48 hours to confirm bits with Hans. Nearly there!
LD: My apologies. It's your extensive Decca mono collection that threw me. It's easy to forget that there are other under 50s on this forum sometimes
LD
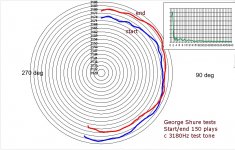
One more polar plot that is interesting and relevant to George's Shure before/after 150 plays test.
One can examine the test tone section from George's Shure test recordings that is near 3150Hz as a polar plot: even though it's only about 1s long and doesn't span a complete revolution there is still a usable fragment. Attached is a polar plot that shows before/after 150 plays from George's Shure sections, No 11 section to be precise.
Good news is that stability generally is very good on this rig - this is much more like a good rig should be IMO. And there is very little difference in stability generally between the before/after 150 plays, suggesting stylus-groove friction remained much unaltered IME. This tallies with much unaltered conventional LF spectrum.
Strangely however, one can see that the two files appear to have different once per platter revolution start points, as though the record had been centred differently perhaps......however we know that George didn't remove the record from the TT, so some other TT drive strangitude must have caused this effect.
It does explain the very weird effect that different sections of the before/after test track recordings appear to have different relative frequency offsets. Some fast, some slow. But now we know that, because a section doesn't last a whole revolution, it depends where the section is on the record as to whether it is faster or slower than average - and this relationship apparently has changed between start and end tests.
I hate loose ends, and this one was very tough to explain until now, but has a very interesting cause. It doesn't affect the outcome of test tone amplitude measurements so long as they properly take care of FM spreading - as mine do. But it does highlight yet another pitfall of trying to make precise amplitude measurements of test tones. And who knows what happened back in the day when tools and methods we take for granted on our laptops now weren't even conceived.
Very interesting? The main points are that George's Kenwood rig used for the test is generally very stable at LF, but drifted as to phase of polar speed variation around the platter in the course of the 150 plays.
LD
Attachments
Last edited:
Ah ah. Thanks for that. When I looked at different passes or different frequencies of the same file I'd see some fast, some slow. I couldn't figure it out.It does explain the very weird effect that different sections of the before/after test track recordings appear to have different relative frequency offsets. Some fast, some slow. But now we know that, because a section doesn't last a whole revolution, it depends where the section is on the record as to whether it is faster or slower than average - and this relationship apparently has changed between start and end tests
Is is just random instability, or something else? If you get time, may plot the Stanton files, say passes 1, 6 and 12. If there a drift? How about the late plays, are the closer to the 150 Shure? Just wondering if it's random fluctuation or a progressive drift.
Cool, I'd like to get my order in tomorrow, just needed to know about the chips cuz I'd like to order the boards from twisted with the chips in placeThe Low-Z board uses 1642s in the servo. One per board. Gimmie another 48 hours to confirm bits with Hans. Nearly there.
I have a hunch that something has slipped - perhaps simply the record on the mat - over the course of the 150 plays !?Is is just random instability, or something else?
Yes, I'll turn attention to the very interesting 150 plays on the Stanton, and the 300Hz@+12dB tests that apparently point to that cartridge performance progressively improving.........(!!!)If you get time, may plot the Stanton files, say passes 1, 6 and 12. If there a drift? How about the late plays, are the closer to the 150 Shure? Just wondering if it's random fluctuation or a progressive drift.
I wonder if it's possible that 300Hz@+12dB (and beyond) re-laps the stylus wear flats, and/or conditions the stylus suspension elastomer ? Peak angle for groove walls is about 25 deg or so...........repetitively for tens of thousands of cycles at high force...........?
You heard it here first, only on diyaudio !
LD
Last edited:
- Home
- Source & Line
- Analogue Source
- mechanical resonance in MMs