Hello Friends.
Might be easier if I explain what I'm doing. I have an opamp constant current source that is varied by the voltage on its non-inverting input. I want to model the current through the load output by varying a potentiometer on the non-inverting input. I started out varying the value of the resistive elements of the pot and plotting on a paper graph the load current but was thinking there must be an easier way to do this with such a basic circuit / simulation.
The step does work as it gives me various curves, except its difficult to work out what curves (flat DC current lines actually) relate to what values.
Hello
I've done many sim with LTspice. But wen, in some amps circuits, I ad a boost filter it's change totally the distortion FFT spectrums, boosting much more the distortion than it could possibly normally happen.
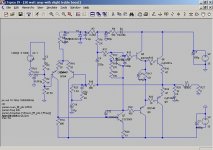
I have done a small 50 w amp sim, as an example, to show the problem, in the second amps I've add a 5 db treble boost in the gnfb. Even if we count the 5 db boost, it should not do so much more distortions.
Which setting I have to change to get it right ?
I include a zip file of the .asc files of the two amps.
Thank you
Bye
Gaetan
I've done many sim with LTspice. But wen, in some amps circuits, I ad a boost filter it's change totally the distortion FFT spectrums, boosting much more the distortion than it could possibly normally happen.
I have done a small 50 w amp sim, as an example, to show the problem, in the second amps I've add a 5 db treble boost in the gnfb. Even if we count the 5 db boost, it should not do so much more distortions.
Which setting I have to change to get it right ?
I include a zip file of the .asc files of the two amps.
Thank you
Bye
Gaetan
Attachments
Hello Friends.
Might be easier if I explain what I'm doing. I have an opamp constant current source that is varied by the voltage on its non-inverting input. I want to model the current through the load output by varying a potentiometer on the non-inverting input. I started out varying the value of the resistive elements of the pot and plotting on a paper graph the load current but was thinking there must be an easier way to do this with such a basic circuit / simulation.
The step does work as it gives me various curves, except its difficult to work out what curves (flat DC current lines actually) relate to what values.
see the wiki description of the .step command (Useful Commands - diyAudio) it has a description of how to understand which trace is which value.
Gaetan -
you need to name the net you want to run the FFT on (for example amp_out) and change your .four command:
.four {freq} 9 8 V(amp_out)
That will run the FFT over 8 cycles of the node named amp_out and display results for 9 harmonics.
Try running the basic simulation for different time periods and seeing if the .four results stay constant. If not then it is probably caused by voltage drift on C14. Try replacing C14 with a voltage source (set it to 0) and see if you get consistent .four results.
Discussion of all of the above is on the wiki Common Issues Encountered By New Users - diyAudio
see THD measurement and Slanted FFT topics
Hello
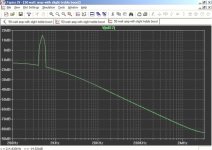
Reading the Common_Issues_Encountered_By_New_Users wiki, it seem that my problem is a Slanted FFT.
I did replace c14 with a voltage sources but nothing changed.
The image are the circuit before replacing c14 with a voltage sources, the fft are same with and without replacing c14 with a voltage sources.
Bye
Gaetan
Attachments
Last edited:
may be slow transient settling - give a start time in the .tran that allows it to settle out
windowing also reduces the settling time effect - try Blackman window
.four and assoc params only applies to the legacy numerical output in the error log - not the graphic plot fft - you have to setup the graphic fft length, windowing, ect in the pop up window
you can experiment with the fft start, end time in the pop-up window
Last edited:
sometimes you can get a better starting bias point by using the .savebias, loadbias pair - initialize by saving the bias after a really long run - say several seconds in your example
then use .loadbias to start shorter analysis sims
it doesn't work as well as I'd like when HF dynamic signals are upsetting the bias since dynamic state - I thru C and V across L isn't saved
you could Hi Pass fliter the signal you want to look at - buffer with an E vcvs to avoid loading effects
then use .loadbias to start shorter analysis sims
it doesn't work as well as I'd like when HF dynamic signals are upsetting the bias since dynamic state - I thru C and V across L isn't saved
you could Hi Pass fliter the signal you want to look at - buffer with an E vcvs to avoid loading effects
Which Spice Models to use with LTSpice?
Hi,
I've just downloaded LTSpice and started to try it out. Most of the BJTs I need are not in the download package.
Looking at Fairchild they have both PSpice and HSpice models. Are either compatable with LTSpice?
Looking at the first post in the thread it was mentioned that a .TXT file might be available for BJT's presumably used in audio. Is there are link/reference for this?
Cheers
Hello
I have another question about LT Spice.
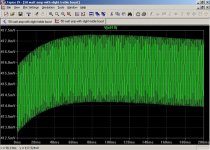
With some amps circuits, wen I do modifications and I check the distortions FFT, I get an inverted harmonic peak, like in the image I include.
What does it mean ?
Thank
Bye
Gaetan
I have another question about LT Spice.
With some amps circuits, wen I do modifications and I check the distortions FFT, I get an inverted harmonic peak, like in the image I include.
What does it mean ?
Thank
Bye
Gaetan
Attachments
Last edited:
")
Just to be clear, I just think it's cool to see someone else looking at the Rush Cascode. If it's okay, I would like to hear your thoughts on it when you get the amp running.
I'm afraid I don't know why the negative peak is there; I always assumed it was harmless because it seemed to be a reasonable value of the harmonic at that point.
If it is an error, it is likely just an error in the FFT process.
Maybe I shouldn't have answered without a good response. :/
- keantoken
the "nverted" peak seems to be (and i have been using LTSpice for several years) an actual value. this seems to happen if you have a DC component to the signal being measured. LTSpice sees an actual value for (in many cases) a second or third harmonic, and it's lower than the present portion of the trace, so LTSpice draws a line down to it, then back up. if you eliminate the DC component, then you will see the tace at the noise floor going up to the harmonic that was shown as a dip.
- Status
- This old topic is closed. If you want to reopen this topic, contact a moderator using the "Report Post" button.
- Home
- Design & Build
- Software Tools
- Things you should know about LTSpice