@barleywater
Now try to measure at different locations, even small ones. Consider that you have EQ'ed out reflections, which you have measured with the microphone, but which come from e.g. the side wall, which means that your ear will perceive a completely different signal (thikn about HRTF), or the signal will never reach the ear (reflections from the left, right ear is shadowed).
Doing such a brute force method does not take these thing into account. The result will be, in my experience, better than without EQ, but it is not optimal.
Baseballbat;
In above I've referenced at 9" and shown measurements at listening position, with and without windowing to show direct v with room effects.
I've done many measurements on and off axis with various data treatments. With speaker referenced to flat response with linear phase off axis response measurements windowed for direct response reveal detailed information about speaker directivity.
Measurements with room reflections provide information about the room.
Measurements with direct response windowed out show room response at measurement point relative to source point. With enough measurements and computational power, the size, shape and reflective properties of various boundaries may be computed. Imaging sonar.
The measurements Barely used for driver EQ don't have significant reflections. I think using a dual gate from more like 18" and averaging several across, say, 5°, could be better, but it looks fine to me. This is just DSP crossover design with a very tiny speaker, not any sort of "room correction". When it comes to that, we've got this image:
You could take a bunch of these measurements around the listening area, average them, smooth a little (in your imagination or actual smoothing), and apply gentle corrections below 300Hz-ish. For example, pretending the above measurement was the average, you might draw a line between the shoulders of that null above 100Hz, and then smooth out the ~4dB dip that's left, take down the ~180-300Hz range a little bit, and call it a day.
Right?
An externally hosted image should be here but it was not working when we last tested it.
You could take a bunch of these measurements around the listening area, average them, smooth a little (in your imagination or actual smoothing), and apply gentle corrections below 300Hz-ish. For example, pretending the above measurement was the average, you might draw a line between the shoulders of that null above 100Hz, and then smooth out the ~4dB dip that's left, take down the ~180-300Hz range a little bit, and call it a day.
Right?
How divergent are our ears from say a microphone (a good omni cardioid one)?
What interpretation correlation/difference at the main listening position between the two?
How on and off axis sounds are represented inside a human brain, and how they overall affect us?
Can you digitally and 'parametrically' EQ an analog sound like a turntable and make it even more sweet analog sounding? ...And restore the bits (dynamic range and high frequencies) missing?
The best digital rig in the world; does it need to be EQed to sound best in each acoustic space and for the main seat in that space?
... restore the bits (dynamic range and high frequencies) missing?
there may a new digital technology doing something like that
don't know how it works
could be a special voicing/tune software combined with advanced search software
some studio/DJ people may know more about this
Digital has FAR greater dynamic range, so no restoration needed there. It is also rather unusual to get HF content from a turntable that even reaches what is easily handled by high sample rates, let alone exceeds it, but that doesn't seem to stop anyone from going on and on about itCan you digitally and 'parametrically' EQ an analog sound like a turntable and make it even more sweet analog sounding? ...And restore the bits (dynamic range and high frequencies) missing?
") . Or... wait, did you mean the opposite, using digital processing to extend the frequency range and enhance the dynamic range of the vinyl source? I suspect everyone would hate that.
. Or... wait, did you mean the opposite, using digital processing to extend the frequency range and enhance the dynamic range of the vinyl source? I suspect everyone would hate that.
Last edited:
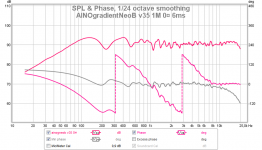
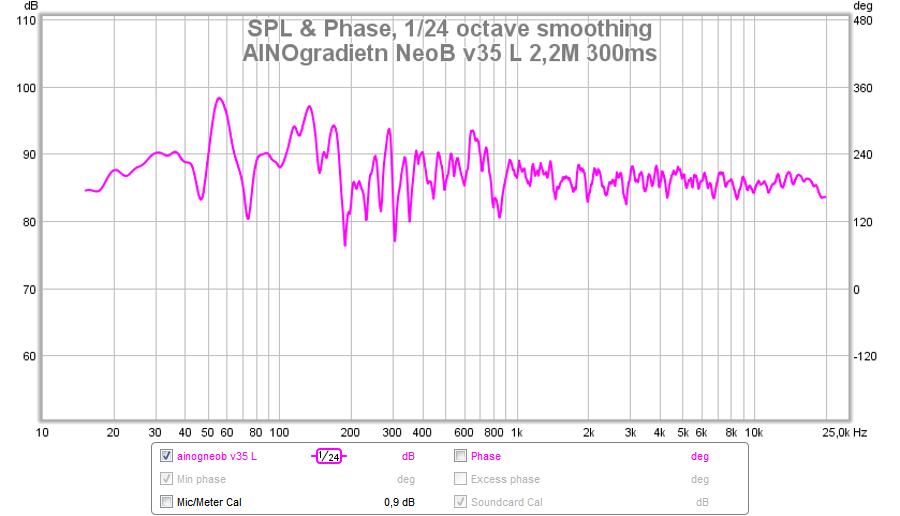
FFT makes time domain analysis easy. @barleywater shoved only gated measurements of some undefined IR gating. This kind of measurents are ok for speaker analysis. But when we evaluate and analyze speakers in a room, decay response analysis is important. There are many ways to visualize it, waterfall, spectum, wavelet etc. <6ms is most important but ears pick up much longer reverberations.
Direct and delayed sound should be in harmony. Room's reflective spectrum and RT time should be in harmony. This is very difficult. Below Schroeder modes are a different story.
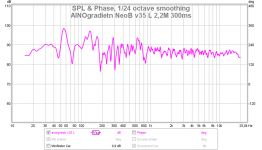
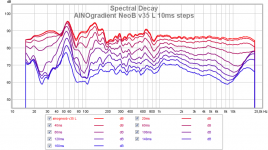
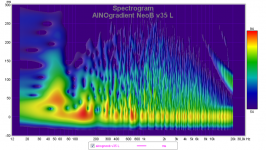
This is my diy dipole speaker at 1m 6ms gating, 2,2m 300ms gating, 2,2m short decay and long decay and wavelet transform. All done with REW.
Interpreting of the data is important. And then, what to do, how to do?
Direct and delayed sound should be in harmony. Room's reflective spectrum and RT time should be in harmony. This is very difficult. Below Schroeder modes are a different story.
This is my diy dipole speaker at 1m 6ms gating, 2,2m 300ms gating, 2,2m short decay and long decay and wavelet transform. All done with REW.
Interpreting of the data is important. And then, what to do, how to do?
Attachments
Digital has FAR greater dynamic range, so no restoration needed there. ....
I was referring to restoring what have previosly been digitally changed
I guess it is somewhat similar to converting a black and white movie to color
you can pick any bits you want, and change the pitch on those only, without affecting any other
not really anything new, but the combination with new technology is (new advanced search machines might be one main part)
Most of them are the full window with no smoothing, only one significantly-gated graph, but the first few are only 9". These two measurements are pretty much the same type:FFT makes time domain analysis easy. @barleywater shoved only gated measurements of some undefined IR gating.
An externally hosted image should be here but it was not working when we last tested it.
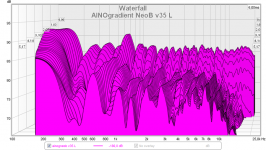
Sory I skipped this CSD, 0-6ms decay
What's creating the 680 Hz ridge?
It is a reflection (sharp up/down). Does not appear on the R channel/speaker. I have not figured out exactly what causes it, layout is pretty symmetric.
We should always take several measurement with some changes - to learn what change has which effect. It is unbelievable how small changes can be seen in time domain! Ambient noise is difficult - play loud at least 90db!
We should always take several measurement with some changes - to learn what change has which effect. It is unbelievable how small changes can be seen in time domain! Ambient noise is difficult - play loud at least 90db!
Speaking of REW ::
Room EQ Wizard: REW Room Measurement Tutorial - YouTube
_______________
Room Tuning (by Tony Grimani) ::
Seminars Room Tuning - YouTube
Room EQ Wizard: REW Room Measurement Tutorial - YouTube
_______________
Room Tuning (by Tony Grimani) ::
Seminars Room Tuning - YouTube
REW does not give same kind of burst decay as ARTA, but close. Parameters can be set - gating, rise time, interval.
Test signal is different, only sine sweep in REW for these. I have installed the free ARTA but I find the learning curve is too low for me. Any program you use, you must do hundreds of measurements to "get hold of it" - then you learn to interprete measurements and utilize them to make changes in your system. The real challenge is to understand the interaction of speaker proterties and room.
There are even more analyzers for room interactions andin the scientific research and acoustic design professionals. https://mediatech.aalto.fi/en/research/virtual-acoustics and https://mediatech.aalto.fi/en/resea...t-and-analysis/84-spatial-plotting-techniques
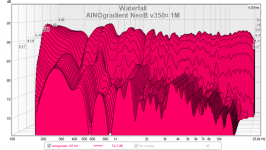
What's creating the 680 Hz ridge?
Here is the same speaker, moved far off from wall and measured at 1M distance. CSD decay graph parameters are same as in previous farfield graph, speaker position and measuring distance are different.
Attachments
Thanks Northstar. I usually don't quote myself, but when I do
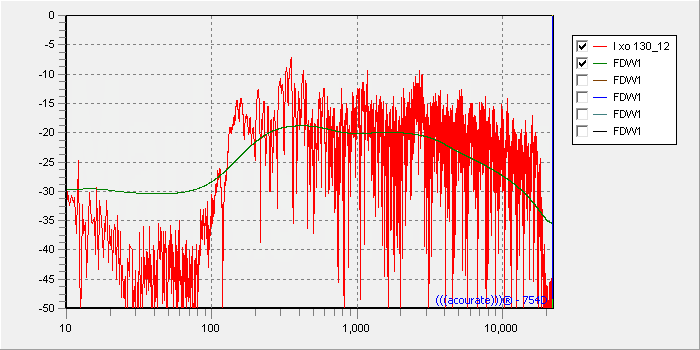
Attached is the dialog box that is applying the variable frequency domain windowing to calculate the psychoacoustic frequency response. Another dialog box also uses FDW to correct phase response, but that is another topic for another time.
The result of which can be seen in the chart. The red trace is the non-smoothed or raw frequency response. The green trace is the psychoacoustic frequency response. Note the difference in both the low frequencies AND the high frequencies.
It is the green (psychoacoustic) response that is used to calculate the FIR filter. Note how this is different than virtually any other room measurement/correction software, except the ones using FDW. The end result also sounds very different. And to my ears, superior to anything else I have heard by a large margin.
What I don't understand is why Acourate applies psychoacoustic filtering ("filling" dips) before applying a sliding window. I'd think that it should be the other way around.
I think before we can answer how to equalize (or more generally, how to acoustically treat) the speaker/room interface we would need to answer the question "what do we hear"?
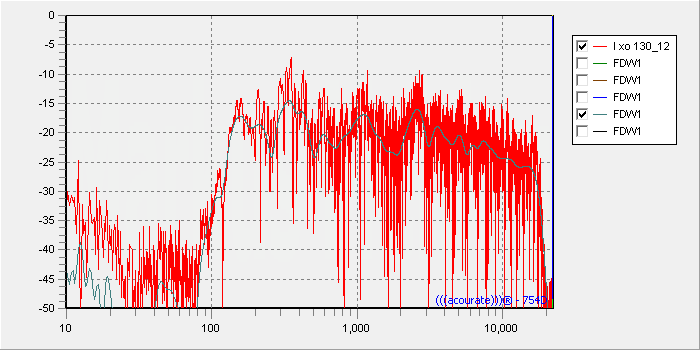
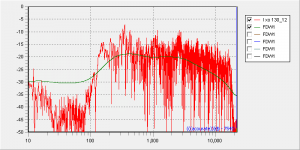
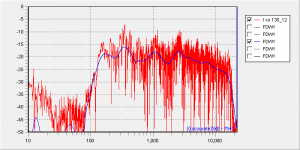
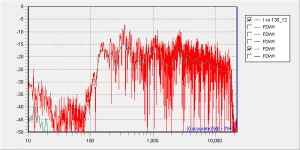
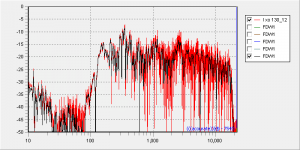
I've attached in-room magnitude responses of my left speaker with different frequency dependent windowing applied. The red trace shows the response with a fixed window.
1 cycle:
2 cylcles:

4 cylces:

8 cycles:
64 cycles:

Does any of these curves represent what we hear? Maybe in terms of tonality?
I've attached in-room magnitude responses of my left speaker with different frequency dependent windowing applied. The red trace shows the response with a fixed window.
1 cycle:
2 cylcles:
4 cylces:
8 cycles:
64 cycles:
Does any of these curves represent what we hear? Maybe in terms of tonality?
Attachments

It is
Not sure if this is useful Markus:
Acourate
1) Computer Audiophile - Acourate Digital Room and Loudspeaker Correction Software Walkthrough
2) Computer Audiophile - Advanced Acourate Digital XO Time Alignment Driver Linearization Walkthrough
_______________
Dirac Live
* Dirac Live Room Correction Software Review | Ultra High-End Audio and Home Theater Review
What I don't understand is why Acourate applies psychoacoustic filtering ("filling" dips) before applying a sliding window.
I'd think that it should be the other way around.
Not sure if this is useful Markus:
Acourate
1) Computer Audiophile - Acourate Digital Room and Loudspeaker Correction Software Walkthrough
2) Computer Audiophile - Advanced Acourate Digital XO Time Alignment Driver Linearization Walkthrough
_______________
Dirac Live
* Dirac Live Room Correction Software Review | Ultra High-End Audio and Home Theater Review
There's something wrong with your measurements or methodology Markus.
Regardless of window length your high frequency response has basically the same fall off slope. If your speakers on axis response is flat in the treble the treble response should look flatter and flatter as the window shortens without the droop you see in a typical room power response. Your graphs look more like post FFT smoothing than windowing of the impulse.
Also although a sliding window has been proposed to better model human hearing I don't think it's a one for one linear relationship that you can model by making the window length a fixed number of cycles.
More like steady state at low frequencies, direct field at high frequencies and a transition region of 2-3 octaves in the midrange.
Last edited:
- Status
- This old topic is closed. If you want to reopen this topic, contact a moderator using the "Report Post" button.
- Home
- General Interest
- Room Acoustics & Mods
- Room Correction with PEQ