goudey said:
Pavel,
Some amplifiers are more particular than others regarding the driving impedance of the source. An amplifier may perform well with a low source impedance, and poorly with a high source impedance. We won't know what is the case unless a suitable test is performed.
Dale
Dale,
as I have already stated I am using only a low impedance source for power amplifiers, not only for testing, but also for listening (buffer based preamplifier).
Pavel
jcx said:
but my point is that the "ordered complexity" of PMA's fm test tone, with many n*fmod sidebands will have large, distortion obscuring signals at many of the IMD product frequencies - and many more IMD product frequencies will be the summation of multiple orders of IMD from many of the (equally spaced) fm sidebands
That's right and I belive that the amplifier producing lowest magnitude of IMD products is the best one. For some reason here are often preferred amplifiers producing high level of mess. They are said to be "musical" etc. I assume this approach completely wrong and these amps fail when playing complex music signal like philharmonic orchestra. I am trying to show that the really good amplifier must not add much new components even to the very complex signal.
What we can see from the FM signal are the copies of original spectrum at 2fc, 3fc etc. and IMD products. The same will happen for the music signal. The worse the amp, the more mess it produces.
I have added a number of measurements to the original link:
http://web.telecom.cz/macura/fmanalysis/freqdist.html
concerning AD844, LT1122, OPA627, AD797 and OPA134 opamps in the error correction amplifier, and further FM modulated test signal.
http://web.telecom.cz/macura/fmanalysis/freqdist.html
concerning AD844, LT1122, OPA627, AD797 and OPA134 opamps in the error correction amplifier, and further FM modulated test signal.
PMA said:I belive that the amplifier producing lowest magnitude of IMD products is the best one.
Take a look here. Besides the presentations, it's worth finding the actual AES papers. On the results page, correlation between IMD and perception is weak (likewise for THD). These guys clearly show that better metrics are needed. Now, I don't think their particular proposal is all that great, but at least it's a start. Not taking into account frequency dependent nonlinearities is a major shortcoming, especially when considering the whole signal chain.
Mike Gergen said:I was expecting to see bigger differences when using different op amps.
Mike, me too
Prune said:
Take a look here. Besides the presentations, it's worth finding the actual AES papers. On the results page, correlation between IMD and perception is weak (likewise for THD). These guys clearly show that better metrics are needed. Now, I don't think their particular proposal is all that great, but at least it's a start. Not taking into account frequency dependent nonlinearities is a major shortcoming, especially when considering the whole signal chain.
Try to analyze their waves by Cool Edit, for example. It is a signal corruption what they have done (especially at low levels), that's why it is so annoying. This is everything but argue against spectral analysis. We never use only one measuring method and the problem of signal corruption can be easily identified.
Null test results.
I snatched some time last weekend to explore the idea of a frequency / time domain null test in an actual situation.
To that end, the simple circuit shown below was analyzed, results are also included and the full simulation and worksheet files are zipped in a subsequent post.
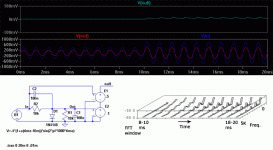
The circuit consists of a compensated attenuator where a mild nonlinearity has been added by the way of a diode. The capacitance was included to stimulate a reasonable transient condition.
The stimulus consists of 10 mS of 1KHz tone with an amplitude below the diode threshold, continued coherently with the same signal but twice the amplitude so as to put the diode slightly into conduction. I included the controlled voltage sources to ease the repetitive plotting of the null signal 0.5*V(in)-V(out).
The lower plot panel displays the input and output waveforms, while the upper one depicts the null signal. Note the null signal plot scale is 10 times more sensitive than the input and output signal scale.
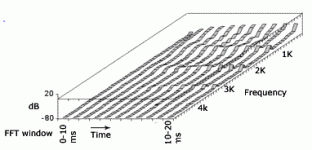
The waterfall diagram at lower right was constructed by export of FFT plots of the null signal, using a sliding window of 2 mS aperture from 8-10 mS to 18-20 mS.
In the next post, the same null waveform is treated in the same manner, but in this case the sliding FFT window aperture is set to 10 mS bringing frequency resolution from 500 Hz to 100 Hz. Selecting the FFT aperture involves a tradeoff between frequency domain resolution and time domain resolution. A larger one will provide better frequency resolution at the expense of averaging for longer times, thus smearing short term variations while the converse is true for a shorter one.
Interestingly this very constraint adds a further control parameter for analysis, for since we are after all looking for objective measurements that could correlate with the listening experience, and the ear in turn is in essence a spectrally sensitive instrument, the possibility to balance time and frequency resolution may well be an added bonus.
Attachments
Null test files
Schematic file for null test, stimulus, and Excel worksheet. The procedure was to export each FFT result and import data in the worksheet, plotting the results.
This approach obviously is only a rough and fast method suitable for processing a very small dataset. I did not want to plunge directly to programming in MathCad to automate the whole process with arbitrarily large datasets before testing a sample case.
Comments, critique, suggestions welcome.
Rodolfo
Attachments
PMA,
I believe FM method was thought about as soon as FM for audio became practical. I've seen this discussed. It was dropped as a method. I can't recall the exact reasons, but I'd put here few thoughts that might be relevant.
First thing that comes to mind is that spectral analysis is precise for periodic signals alone. Yes you can consider whole waveform as a periodic signal, but then you have different meanings to harmonics and THD. Signals with changing spectral content are not suitable for flat spectral analysis. Instead you'd need waterfall style analysis.
Then, you always have compromise between spectral resolution and time-axis resolution. Maximal spectral resolution is when any given unique harmonic is present for infinite timescale. Its not so with FM.
What this might mean in your case is that the harmonic addition from the amps under test are understated, because by making flat spectrum analysis you are getting spectral power averaged over considerable time. To get better picture, you'd need to at least make full FT analysis with real and imaginary parts (phase data).
Because you are analysing nonperiodic complex signal, each spectral data point has increased importance to be able to reconstruct original waveform. By taking only power spectrum is masking underlying changes alot. The changes are spread across the spectrum of your FFT window.
Then, spectrum of FM signal is mathematically infinite. It is. No Amp has infinite BW, so some distortion of FM signal is unavoidable. It would manifest as weak AM perhaps, or as increased THD. This is further polluting measurements, making it hard to distinguish distortions from BW limiting vs. amp nonlinearity.
Basically, FM signal is not just abit more complex for device under test, it is also extremely complex for analysis. The simple fact that one device shows less spectral content on output does not necessarily mean that this can be easily correlated with what actually happens or what is audible. I think the difficulty to correlate was the reason this method never took off.
As to measurability of audible differences, my personal opinion is that they get hidden behind similar issues of flat spectral analysis averaging. To reveal them, transients needs to be explored with good time resolution, i.e. perfect waterfall.
PS. many kinds of subtle time-domain distortions can be brought down to equivalent of signal correlated jitter. That might expose quite alot.
http://www.essex.ac.uk/ese/research...Current steering transimpedance amplifier.pdf
wimms said:
First thing that comes to mind is that spectral analysis is precise for periodic signals alone.
As to measurability of audible differences, my personal opinion is that they get hidden behind similar issues of flat spectral analysis averaging.
PS. many kinds of subtle time-domain distortions can be brought down to equivalent of signal correlated jitter. That might expose quite alot.
http://www.essex.ac.uk/ese/research...Current steering transimpedance amplifier.pdf
Wimms,
thank you very much for your valuable input. And also thank you for the interesting link.
Regards,
Pavel
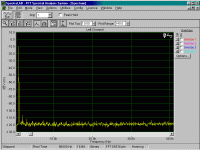
I have promised to show the THD spectrum result of the error correction power amp. So here it is, measured at 1kHz, 1dB below limitation, 8 Ohm load. With AD797 chip. Signal from CD generator and it is the CD that contributes greatly to final distortion. Not too bad  . Now compare with FM method results. What is more severe?

Attachments
wimms,
I went quite thoroughly through your analysis at
http://www.diyaudio.com/forums/showthread.php?postid=512699#post512699
I mostly agree but I have a small comment: the FM signal was generated by sound card at sampling rate of 48kHz, so it was bandwidth limited to 24kHz. Amplifier under test had much broader bandwidth, so it should not bring much linear distortion.
- Status
- This old topic is closed. If you want to reopen this topic, contact a moderator using the "Report Post" button.
- Home
- Amplifiers
- Solid State
- New distortion measurement method for audio amplifiers


