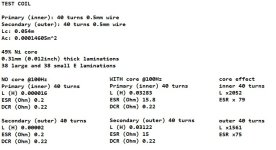
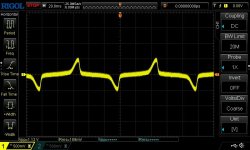
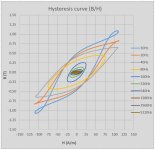
I made a test transformer with a few turns and thick wire just to test the B/H curve of the core
Zeta4 please check the H, B numbers. Are they realistic?
George
Zeta4 please check the H, B numbers. Are they realistic?
George
Attachments
Last edited:
A (larger) gap linearises the behaviour of the core.Inductance is a parasitic property like DCR - an optimized trafo has the lowest DCR and the highest inductance. Introducing an airgap will only lower the inductance and thereby degrade the LF response.
GeorgeI made a test transformer with a few turns and thick wire just to test the B/H curve of the core
Zeta4 please check the H, B numbers. Are they realistic?
George
B number looks about right, the curve is beginning to flatten out to somewhere around 1.2T. Not sure about the H numbers though as the curve
looks wider than I would have expected. I'll check in my files but its probably OK.
OK, I just wondered if there was anything special you were looking for. Ideally the a loop for a typical 49% material peaking at 1.4T
would cross the H axis at around 20 A/m but this is without any gapping. Even the normal lamination overlap would increase this but not
to the level on your plot. Anyway I hope you manage to sort it out.
would cross the H axis at around 20 A/m but this is without any gapping. Even the normal lamination overlap would increase this but not
to the level on your plot. Anyway I hope you manage to sort it out.
I was listening for differences btn the 1k4 turns and the 7k turns AVC.
I made some recordings of the same musical piece, first of the non attenuated , then of the 10dB attenuated and then of the 20dB attenuated content. I thought to share the files. There will be at Dropbox for a week
You may download them , listen to them and say what you think of any difference you may notice or not.
George
Attachments
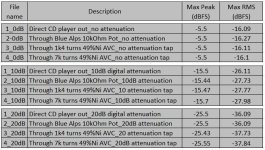
First the links for the non attenuated content:
https://www.dropbox.com/scl/fi/o11p8xibdh6fdwlf7jw7s/1_0.wav?rlkey=ho0e1xp1yzyh1m02v3idmqwz7&dl=0
https://www.dropbox.com/scl/fi/otbmznpf318yi589td924/2_0.wav?rlkey=l3qlgcgyv8saoacnrfj4cbpzf&dl=0
https://www.dropbox.com/scl/fi/kop0dqchs2e8p4p9wfx58/3_0.wav?rlkey=aztfmhdy39f0dnen6mrvy4xg7&dl=0
https://www.dropbox.com/scl/fi/qirg8eolwbgctyqckn0b2/4_0.wav?rlkey=ix66vy55q4irgx8c94fvoka8q&dl=0
Next the links for the 10dB attenuated content:
https://www.dropbox.com/scl/fi/e04fwvjqff639eqoavc7v/1_10.wav?rlkey=4vzy1jxwvdzhtrfv1awl011gb&dl=0
https://www.dropbox.com/scl/fi/kdfmw3idqvazw4notmqbo/2_10.wav?rlkey=cveearm1h9js8t1xq2jc9cdw8&dl=0
https://www.dropbox.com/scl/fi/2bfkizx7qh5zsbsdbksp4/3_10.wav?rlkey=zz21pocm097ed0a1f0cu07kxf&dl=0
https://www.dropbox.com/scl/fi/opjldbe8b7f7607a5j75m/4_10.wav?rlkey=sfv7wzhxp5ciggn01aeip8t0t&dl=0
Last the links for the 20dB attenuated content:
https://www.dropbox.com/scl/fi/9nnqkc1a9g28olh2hnba7/1_20.wav?rlkey=blz25jetbz3l22wuet9tsost2&dl=0
https://www.dropbox.com/scl/fi/tog3x7ls1alyyaw9idrdr/2_20.wav?rlkey=o81ksil5mm2pmg71km9oqd3i4&dl=0
https://www.dropbox.com/scl/fi/a26lerkw3ifsgxn70zayj/3_20.wav?rlkey=95po1suuoybpb2pap74y0tk2j&dl=0
https://www.dropbox.com/scl/fi/e3uog0i2c87l88bubqf66/4_20.wav?rlkey=sqqkhk3l9m4sv5l7pghvmummw&dl=0
I forgot to mention that
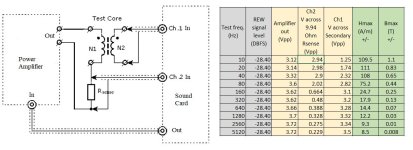
CD player (Rotel RCD-965BX) Ro=200 Ohm. Vout=2Vrms. The musical track played has a max at -7.5dBFS. Therefore max Vout=0.84Vrms
Sound Card (M-Audio Audiophile USB) Rin=10kOhm
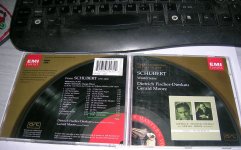
Musical tracks are dual mono 16/44.1 recorded with Steinberg Wavelab 4.0
George
CD player (Rotel RCD-965BX) Ro=200 Ohm. Vout=2Vrms. The musical track played has a max at -7.5dBFS. Therefore max Vout=0.84Vrms
Sound Card (M-Audio Audiophile USB) Rin=10kOhm
Musical tracks are dual mono 16/44.1 recorded with Steinberg Wavelab 4.0
George
OK! There is not much I could detect anyway. No difference in dynamics, back round noise and soundstage imaging. Clearly, the Alps sounds a bit warm at all settings. I've learned to associate this with 2nd order harmonics. Both AVC do not suffer from this, at least not significantly but the 1k4 lost brightness at -20dB. This is as far as I can tell. I hope it helps.
Thank you Kostas.
The musical track I chose may seem to be lacking some attributes for a test track.
It expands in the mid frequency range only and doesn’t have great dynamics.
But it’s a piece of music that I can hear at low levels too, without losing anything from it’s character.
Online I have read a lot of opinions that AVCs somehow excel in keeping the ‘body’ of the music intact when lowering the volume, while when using a resistive potentiometer for attenuation, this ‘body’ becomes thinner.
My conclusion from repeatedly listening to these test tracks (and segments of those) is that none of the two AVCs that I have wound produce such a magic outcome.
I was already prepared for such a result from the frequency sweeps (FR and distortion) I had done but I said “you never know”.
Then, after listening, I said “it’s because you are biased and totally deaf”.
So Kostas, yes it helps to read that another person doesn’t find any big difference btn these test files.
")
George
The musical track I chose may seem to be lacking some attributes for a test track.
It expands in the mid frequency range only and doesn’t have great dynamics.
But it’s a piece of music that I can hear at low levels too, without losing anything from it’s character.
Online I have read a lot of opinions that AVCs somehow excel in keeping the ‘body’ of the music intact when lowering the volume, while when using a resistive potentiometer for attenuation, this ‘body’ becomes thinner.
My conclusion from repeatedly listening to these test tracks (and segments of those) is that none of the two AVCs that I have wound produce such a magic outcome.
I was already prepared for such a result from the frequency sweeps (FR and distortion) I had done but I said “you never know”.
Then, after listening, I said “it’s because you are biased and totally deaf”.
So Kostas, yes it helps to read that another person doesn’t find any big difference btn these test files.
George
Dear @Zeta4I'm pleased to see that your making very good use of the lams. With 7k turns I would think that your primary inductance will be very high
and probably more than you need for good LF response. So I think there is plenty of scope for the "pinstriping" we talked about which would
reduce 3rd harmonic distortion for a given i/p signal level. Keep up the good work.
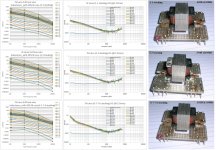
I worked a bit with the "pinstriping" i.e. different core laminations stacking.
Below is the result with 1-1, 3-3, 6-7-7-6 alternate stacking.
With gap increasing, I don't see 3rd distortion reducing anywhere in the audible freq. range.
What I 'm doing wrong?
George
Attachments
Hi George
Thats a bit disappointing but I dont think you are doing anything wrong. The only thing that differs from my experience is the relatively
high numbers of turns you are using. By contrast Ive rarely used more than 4K turns. This will affect the flux density by the square of
the turns and it will be very low. So its probable that the pinstripping is having no effect at your signal level because of this. You could try
significantly higher signal levels to see if this makes any difference.
I try to minimise the number of turns while maintaining the necessary inductance so as to minimise interwinding capacitance which has
an effect on frequency response. With nickel the permeability of the core is approx inversely proportional to frequency so the inductance
at say 50hz will be a lot higher than at the measured freq of 100hz. I'm not sure about 49% nickel but with 80% it will be nearly double.
So you need to take this into account when you size the required primary inductance for a given low freq cut off with a given source
impedance. Its a bit of a balancing act really.
Geoff
Thank you Geoff for your -as always- valuable contribution.
Yes, the 7k turn inductance is excessive when viewed as a LF cut off parameter.
But I find it as a good one when looking at the results of multitone tests.
Freq response & phase measurements don't show any degradation within the audio band due to the increased interwinding capacitance.
I was listening for acoustic differences btn the (3-3) stacking and the (6-7-7-6) stacking AVCs (7k turns on both).
I made some short 2 minute stereo 48k/24b wav. recordings of the same musical piece, first of the non attenuated , then of the 10.8dB attenuated.
There will be at Dropbox for a week.
George
Attachments
- Home
- Source & Line
- Analog Line Level
- Any chance for a diy autoformer volume control?