hi david
i know about the wizard,ive playing with it for a while
i mean combined filter and eq (these 2 pics merged)
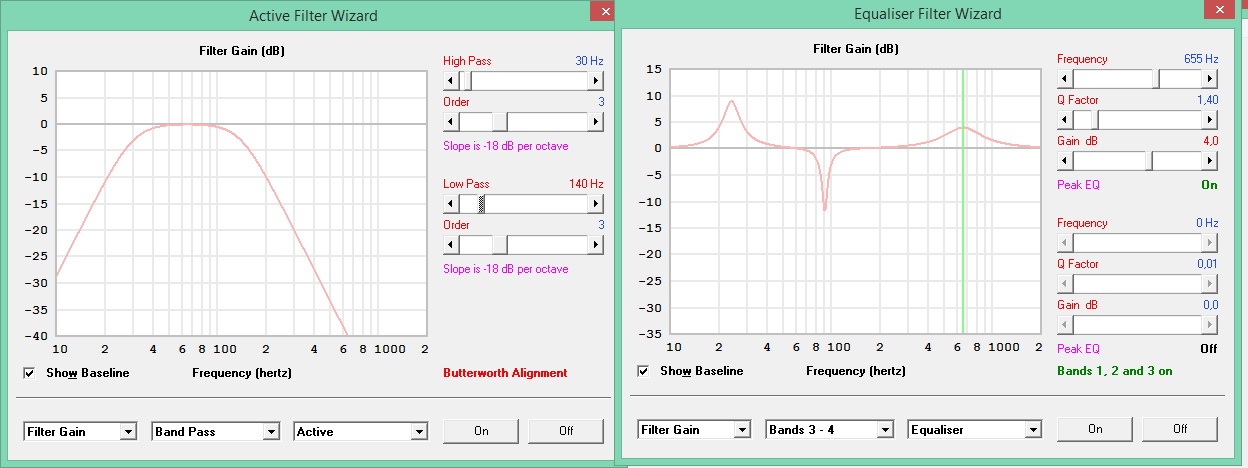
Perhaps the overall response in one colour, red as a custom already in the Hornresp settings and perhaps grey for the filter settings? Something like that?
David, i have a suggestion for the next update. If that is possible.
Can it be made so the window of the software can be made bigger?
Some of us are getting old, and our vision is getting weaker and weaker. Making it possible to be full screen or enlarged to some extent will be of great help.
Thank you!
Can it be made so the window of the software can be made bigger?
Some of us are getting old, and our vision is getting weaker and weaker. Making it possible to be full screen or enlarged to some extent will be of great help.
Thank you!
Marjan, there's a couple ways to do it currently:
1) when I'm using the wavefront simulator, I turn on the windows magnifier tool.
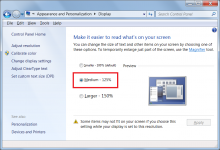
2) I have window set to magnify everything by 200% (it's a slider in "display properties." Note that this will affect everything: fonts, icons, programs, etc
My monitor is 4K, so hornresp measures about 6" in diameter without these tweaks!
1) when I'm using the wavefront simulator, I turn on the windows magnifier tool.
2) I have window set to magnify everything by 200% (it's a slider in "display properties." Note that this will affect everything: fonts, icons, programs, etc
My monitor is 4K, so hornresp measures about 6" in diameter without these tweaks!
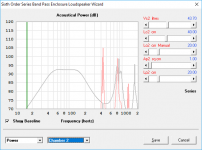
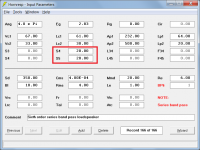
Hey David, I've finally got some time to work on the bandpass workbook, but unless I'm doing something wrong, something seems to be off with the series-tuned 6th order BP calculations in Hornresp.
See attached example. It's basically a 6th order BP with the Ap2 set to zero (which should convert it into a 4th order BP). The response looks as I expect it to be, but if you increase Ap2 to a small value (say 1cm^2), instead of showing little or no increase at low frequencies as I expect would happen, it goes haywire and shows a totally unexpected response.
See attached example. It's basically a 6th order BP with the Ap2 set to zero (which should convert it into a 4th order BP). The response looks as I expect it to be, but if you increase Ap2 to a small value (say 1cm^2), instead of showing little or no increase at low frequencies as I expect would happen, it goes haywire and shows a totally unexpected response.
Attachments
Not a anwer, but I play around this exact kind of sim with +/- this target freq cuve/size/type of speaker since lot of timeHey David, I've finally got some time to work on the bandpass workbook, but unless I'm doing something wrong, something seems to be off with the series-tuned 6th order BP calculations in Hornresp.
See attached example. It's basically a 6th order BP with the Ap2 set to zero (which should convert it into a 4th order BP). The response looks as I expect it to be, but if you increase Ap2 to a small value (say 1cm^2), instead of showing little or no increase at low frequencies as I expect would happen, it goes haywire and shows a totally unexpected response.
") What is this speaker ? Dayton maybe ?
What is this speaker ? Dayton maybe ?i mean combined filter and eq (these 2 pics merged)
Hi epa,
Sorry, I misunderstood your earlier post. Hopefully I've got it clear now
.What would be the benefit in being able to see the combined gain of the two filters? Surely the only thing that really matters is how the applied filters affect the overall system response? I would rather not have to also show the gains combined as separate chart, unless of course there is a compelling reason to do so.
Kind regards,
David
Hi MarjanM,
You are not the first person to ask for this. Unfortunately, the way that Hornresp has evolved, it would be just too difficult to make the change at this late stage. As Patrick Bateman has pointed out, there are ways to reduce the impact of the problem. In my case, I have Windows 7 and use the setting shown in the attachment.
You and me both.
Kind regards,
David
Can it be made so the window of the software can be made bigger?
You are not the first person to ask for this
. Unfortunately, the way that Hornresp has evolved, it would be just too difficult to make the change at this late stage. As Patrick Bateman has pointed out, there are ways to reduce the impact of the problem. In my case, I have Windows 7 and use the setting shown in the attachment.Some of us are getting old, and our vision is getting weaker and weaker.
You and me both
.Kind regards,
David
Attachments
The response looks as I expect it to be, but if you increase Ap2 to a small value (say 1cm^2), instead of showing little or no increase at low frequencies as I expect would happen, it goes haywire and shows a totally unexpected response.
Hi Brian,
Thanks for the feedback. I thought that it used to work correctly, before the automatic BP4 conversion feature was added. I need to investigate
.Kind regards,
David
How to zero the cell
Hi,
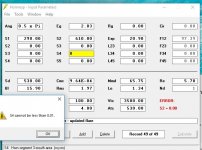
I run into this every so often, and am not sure how to clear the cell to zero? There was data in all four sections of the horn, and am trying to clear all but the first.
I tried zeroing the cells in several different orders, but get the same error.
Thanks, Jim.
Hi,
I run into this every so often, and am not sure how to clear the cell to zero? There was data in all four sections of the horn, and am trying to clear all but the first.
I tried zeroing the cells in several different orders, but get the same error.
Thanks, Jim.
Attachments
Not a anwer, but I play around this exact kind of sim with +/- this target freq cuve/size/type of speaker since lot of time
Yup, the Dayton PA310, with semi-inductance data. I use it for quite a few of my theoretical and "proof of concept" builds.
Thanks for the feedback. I thought that it used to work correctly, before the automatic BP4 conversion feature was added. I need to investigate
No worries. I've been quite busy for the last few weeks, otherwise I would have been working on the workbook and turned up this issue much earlier.
BTW - the "offset" feature for BP is an awesome addition. It really shows how the choice of the box and vent geometry can impact the unwanted out of band response, and how it can be used to reduce it significantly.
Hi,
I run into this every so often, and am not sure how to clear the cell to zero? There was data in all four sections of the horn, and am trying to clear all but the first.
I tried zeroing the cells in several different orders, but get the same error.
Thanks, Jim.
instead of zeroing unused segments, delete them. ..Click in Sx and then hit the delete key...
instead of zeroing unused segments, delete them. ..Click in Sx and then hit the delete key...
Hi nc535,
Hey, that technique worked great!
Thank you very much.
Jim.
hi davidHi epa,
Sorry, I misunderstood your earlier post. Hopefully I've got it clear now
What would be the benefit in being able to see the combined gain of the two filters? Surely the only thing that really matters is how the applied filters affect the overall system response? I would rather not have to also show the gains combined as separate chart, unless of course there is a compelling reason to do so.
Kind regards,
David
the reason is to see the gain after the hpf is aplyed and eqed flat.
it is to compensate the effect of the hpf without exceeding output power(eg)
cheers erik
Quesstion about Cir calculation
Hi David,
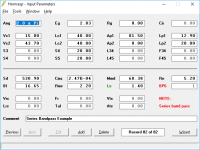
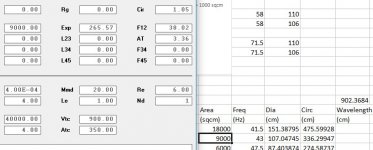
I have a question about how Cir is calculated. In the attachment, we have a flare rate of 38 Hz, a mouth area of 9000 sqcm, and a Cir of 1.05.
The wavelength at 38 Hz is basically 902 cm long, and the mouth circumference is 336 cm.
The question becomes; how do you calculate Cir?
Thanks, Jim.
Hi David,
I have a question about how Cir is calculated. In the attachment, we have a flare rate of 38 Hz, a mouth area of 9000 sqcm, and a Cir of 1.05.
The wavelength at 38 Hz is basically 902 cm long, and the mouth circumference is 336 cm.
The question becomes; how do you calculate Cir?
Thanks, Jim.
Attachments
There was data in all four sections of the horn, and am trying to clear all but the first.
Hi Jim,
To clear segments 2 to 4, highlight any of the segment 2 input boxes, press the Backspace key, then press the Enter key.
Kind regards,
David
Attachments
BTW - the "offset" feature for BP is an awesome addition.
Hi Brian,
Glad you like it
.Ironically, the bug you reported was introduced when the BP4 / BP6 offset driver feature was added. It occurs when the values of Lo1 and/or Lo2 are non-zero - ie offset(s) specified. It will be fixed in the next release. There is also a problem with the Lo1 and Lo2 labels sometimes not being shown on the main input parameters window. This will also be fixed in the next update. Thanks again for reporting the bug, it is unlikely that I would have come across it myself.
Kind regards,
David
Attachments
the reason is to see the gain after the hpf is aplyed and eqed flat.
it is to compensate the effect of the hpf without exceeding output power(eg)
Hi Erik,
Thanks for the additional information. I will have to give it some thought.
Kind regards,
David
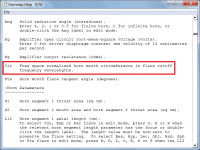
The question becomes; how do you calculate Cir?
Hi Jim,
Cir is the free space normalised horn mouth circumference in flare cutoff frequency wavelengths.
Using your example:
Ang = 0.5 x Pi (eighth space)
S2 = 9000.00
F12= 38.02
Free space normalised horn mouth area = 9000 * 8 = 72000 cm^2
Free space normalised horn mouth circumference = 951.20 cm
Flare cutoff frequency wavelength = 34400 / 38.02 = 904.79 cm
Cir = 951.20 / 904.79 = 1.05
Ideally, for a "no-compromise" bass horn Cir should be 1 or greater, but this can sometimes be difficult to achieve in practice.
Kind regards,
David
Attachments
- Home
- Loudspeakers
- Subwoofers
- Hornresp