Thank you for your reply!
I got it to work now, but only half-way.
There seem to be two problems in my case: displaying the results, and not producing the full spectrum of the input signal.
Comparing the configuration files for a case where a spectrum from the Dummy source is shown, with the one without it, I found out that in the latter case the section <DisplayCharts> is empty, i.e. it is shown as <DisplayCharts/>. When I manually insert this section into the configuration file, the graphics is shown.
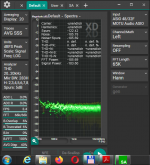
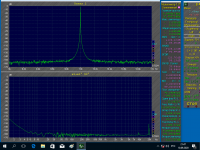
The screenshot attached shows the spectrum I got with my MOTU card after correcting the configuration file, but only the noise floor is shown instead of a very rich spectrum that I expect. My hunch is that the number format 32F is a problem - I don't know whether the MOTU Asio driver supports it. Since this is the only choice I get when configuring the input device, I'm not able to compare it with e.g. 24-bit resolution.
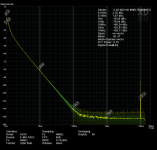
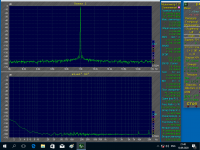
I got my MOTU interface also running in the Wasapi Exclusive mode with 16-bit resolution (higher resolutions are not offered), and the result was as expected.
I'll test the other native Win7 modes as well.
Regards,
Braca
I got it to work now, but only half-way.
There seem to be two problems in my case: displaying the results, and not producing the full spectrum of the input signal.
Comparing the configuration files for a case where a spectrum from the Dummy source is shown, with the one without it, I found out that in the latter case the section <DisplayCharts> is empty, i.e. it is shown as <DisplayCharts/>. When I manually insert this section into the configuration file, the graphics is shown.
The screenshot attached shows the spectrum I got with my MOTU card after correcting the configuration file, but only the noise floor is shown instead of a very rich spectrum that I expect. My hunch is that the number format 32F is a problem - I don't know whether the MOTU Asio driver supports it. Since this is the only choice I get when configuring the input device, I'm not able to compare it with e.g. 24-bit resolution.
I got my MOTU interface also running in the Wasapi Exclusive mode with 16-bit resolution (higher resolutions are not offered), and the result was as expected.
I'll test the other native Win7 modes as well.
Regards,
Braca
Attachments
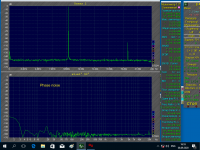
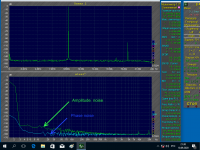
Could you please refer to some keywords/description what "L*L^90" means in the 2nd program?
Most of the noise you see on SA is spectral leakage of window function. I could eliminate it to some degree in next versions, but i doubt the 2nd program uses spectral leakage compensation at all, it must be very different algorithm.
Seems it multiplies the input by digitally generated sine corresponding to input signal's frequency.
Technically it should produce downconverted carrier at 0Hz, and 2*F Hz.
I still don't see how the spectral leakage gets eliminated, unless you turn off the windowing function and rely on coherency.
If you look at 2nd program only, you have a skirt around carrier, which width is much wider than what you see on the phase noise spectra of the same program.
Last edited:
Phase noise measurement function. There is a function for measuring amplitude noise.Could you please refer to some keywords/description what "L*L^90" means in the 2nd program?
Can you find a more appropriate window function? Explanation in the figures.If you look at 2nd program only, you have a skirt around carrier, which width is much wider than what you see on the phase noise spectra of the same program.
Attachments
- Status
- This old topic is closed. If you want to reopen this topic, contact a moderator using the "Report Post" button.