Here is a detailed explanation of an automated process to create a calibration file based on an already calibrated microphone, in this case, for a ECM8000 based on a Cross Spectrum UMIK-1.
Given that i can get the ECM8000 for 40€ locally, i'm going to give this a try ...
Given that i can get the ECM8000 for 40€ locally, i'm going to give this a try ...
Member
Joined 2003
I’ve completed the process several times, for EMM-6 I calibrated two different mic’s against my Omnimic since the calibration provided by Dayton is garbage.
You can use excel, but the processing can be completed completely with VituixCAD calculator tool. If you run into trouble you can always send me your measurements, I’m happy to create the calibration file for you.
You can use excel, but the processing can be completed completely with VituixCAD calculator tool. If you run into trouble you can always send me your measurements, I’m happy to create the calibration file for you.
Thank you very much !!!You can use excel, but the processing can be completed completely with VituixCAD calculator tool. If you run into trouble you can always send me your measurements, I’m happy to create the calibration file for you.
I've contacted CSL, given that i've bought the UMIK-1 in 2017, to ask if the calibration was still accurate, and their response was:
As mentioned in the previous posts, my goal is to use the UMIK-1 to generate the calibration file for a Behringer ECM8000, so i can use the ECM8000 with a UMC404HD to generate the measurements for VituixCAD.
Does the expected slight drift of 1db impact the accuracy of the measures, which can have an impact on the analysis for the crossover design?
Over four years, there will probably be a slight drift in the response, but assuming the mic has been properly handled & stored, the drift shouldn’t be more than 1 decibel or so
As mentioned in the previous posts, my goal is to use the UMIK-1 to generate the calibration file for a Behringer ECM8000, so i can use the ECM8000 with a UMC404HD to generate the measurements for VituixCAD.
Does the expected slight drift of 1db impact the accuracy of the measures, which can have an impact on the analysis for the crossover design?
Member
Joined 2003
If you are that worried, do you expect to send your mic back every few years for re-calibration? Maybe investment in a more stable microphone like Earthworks is a good solution after all... How much difference in response do you get using the mic in a mic clip on a boom stand, versus on a straight pole or wrapping the whole mounting apparatus in foam? You have the mic, and can answer these questions with your own measurements. You may find that up to 1dB error in calibration versus your own measurement rig is possible.
How much do you care about "up to" 1dB of difference? That should be something you should answer for yourself for consideration in many design decisions. Is the 1dB change narrow band, wide band, and at which frequencies?
For a mic, you can expect any error to be at high frequency. Set up some EQ, on PC you can use some software like Equalizer APO. Make some EQ changes at various frequencies, various Q, but all 1dB of change and listen for yourself for the audible difference it makes.
For many designers, you may find often that an adjustment up to 1dB is made from long term listening sessions to fine tune the design to your preference. It's your speaker and design after all, so you must decide what is important.
is this more profound and thorough method when designing a crossover - take every driver s (in cabinet) on axis response and along with 0 180d, then find the acoustic centers difference between the two(in a two way) import them into vituixcad check minimum phase then add all of the drivers distance differences and let it simulate it.then you have a full spinorma at any distance and angle? just like klippel nfs in some way...?
then find the acoustic centers difference between the two(in a two way)
Method recommended for VituixCAD and any other XO simulator using simple geometry calculation with driver locations does not have "acoustic center" concept. Timing difference to mechanical rotation center of each DUT while off-axis measurement sequence is included in phase response, and mechanical rotation centers are entered as location of drivers.
Last edited:
The Audiomatica and the Neumann MA should be around 300€ when adding shipping
The Sonarworks SoundID is by far the cheapest at 66€, but is it good enough?
It's fine. The cheapest XLR microphone with individual calibration.
Here you can read about my experience with Sonarworks: Sonarworks XREF20 unreliable calibration file
I don't trust Sonarworks anymore")
I don't trust Sonarworks anymore
Last edited:
How can I get the calculated impedance curve out in txt format so I can reuse it? The curves which get plotted in the graph after inserting a gain stage: are they automatically stored some place where I can find them?
as an explanation: I modeled and then made a partial Xover: so I am about to measure FR for a group of drivers playing simultaneously; then remodel with a single driver representing the whole group and use measured FRF, but I do not want to measure impedance for the group; just reuse the previously calculated one. Thanks in advance.
as an explanation: I modeled and then made a partial Xover: so I am about to measure FR for a group of drivers playing simultaneously; then remodel with a single driver representing the whole group and use measured FRF, but I do not want to measure impedance for the group; just reuse the previously calculated one. Thanks in advance.
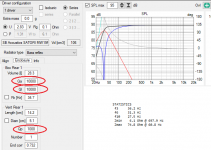
I have a question regarding enclosure tool. My issues is, that when I am looking for good bass-reflex box for different drivers, I always get f3 much higher than for example Madisound (like f3 of 36Hz for Satori MW19P-8), and for the same set of data (28 liters, port dimensions 50x150mm) Vituix is showing me 46 Hz :O
Similar story for other drivers I tested - Wavecor WF223 for the same parameters - 37Hz in BassBox, 42 in Vituix.
Therefore I wanted to ask what is from with the software or what I am doing wrong? Variances on the f3 and port dimensions are really high.
Any suggestions what can I do in order to see proper data?
Add Marani Pseries adn Xilica Solaro
Dear Kimmo,
I have measured all filters in the:
-Marani P-series DSP@96kHz and
-Xilica Solaro DSP@48kHz
I have added all measurements as frequency text files in 2 rar files. Would you please consider adding these DSP devices to the DSP option sin VituixCad?
(I have checked if the devices are compliant with excisting devies in Vituixcad, but sadly they aren't)
Many thanks in advance!
Kees
Attachments
^Xilica's BW=1.0 equals to Q=1.414 for both shelf and PEQ. That is clearly visible in Xilica XConsole 9, but unfortunately not in Xilica Designer 4.3. That information helps much with Designer, but exact simulation of Solaro needs also fs=48k. I will add that.
Marani P series has some issues. PEQ and it's Q factor is compatible with Hypex, FourAudio etc. analog equivalent DSPs, but Q factor of shelving filter is strange. It should be multiplied by 0.666 when entered to VCAD. That looks just a mistake because there's no logical explanation why 2nd order shelf without overshoot would require Q>1. Usually that kind of shelf has Q=0.71.
Another problem is Bessel LP/HP which is inaccurate and looks non-standard. Some 2nd order stage has too low Q factor at least as 4th order HP/LP. Also Butterworth LP/HP is a bit inaccurate, but acceptable. Linkwitz-Riley is exact. I'm not very eager to add manufacturer-dependent sleeve factor to shelving filter though it would be possible assuming that they don't fix that in the furure.
Great, many thanks for the effort !
( and for all your efforts still keeping vituixcad the great piece of software that it is!)
Out of interest ( I know a bit about digital filters and have implemented the Robert Bristow-Johnson filters in dsp software myself and I am aware of the nyquist limitations and differences with analog filters);
could you, maybe in a formula, describe what the differences are between "generic", the class off behringer etc. filters and the solaro? is it purely Q conversion? I had the impression that maybe one is constant Q and the other gain dependant Q?
regards,
Kees
This is a great tool many thanks!!!
I have a very junior question on work flow. I've tried to search the thread and have watched the videos but there is still a disconnect for me.
I'm wanting to fully simulate a design (I know measurements are better) but wanted to get an idea of the design.
I've traced the SPL graphs for both on and off axis for the drivers. I've simulated the diffraction using the diffraction tool and have created enclosures using the enclosure tool.
My question boils down to is how do I add the enclosure + diffraction + SPL traced curves together? More specifically what is the preferred workflow for this?
I see the enclosure tool can add diffraction. I also see the diffraction tool can add the SPL traced data to it. There is a merger tool that merges measurements together but I'm unclear on how to add all 3 of these graphs together to bring into the crossover section. I'm sure I'm missing something trivial.
Thank you for your time.
- Home
- Design & Build
- Software Tools
- VituixCAD