This thread will document a test of speaker cable stored energy using four bundled pairs of zip cord, also known as lamp cord. In this case it's 18 AWG SP-1, which is the thin insulation version.
The test was proposed here by jneutron:
https://www.diyaudio.com/forums/everything-else/193100-speaker-cable-myths-post6617073.html
The test was proposed here by jneutron:
https://www.diyaudio.com/forums/everything-else/193100-speaker-cable-myths-post6617073.html
Just excellent. If there is anything I can do to assist, ask.
If you decide you need to test a cable that is 8 ohm RFZ, I can make it and ship it free of charge, either coaxial or stripline.
jn
If you decide you need to test a cable that is 8 ohm RFZ, I can make it and ship it free of charge, either coaxial or stripline.
jn
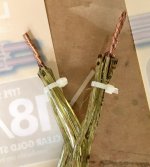
OK JNeutron. I've cut and stacked the zip cords and joined the ends.
The are stacked as flat as is reasonable, but could be tightened up with some more work. I hope this is what you had in mind.
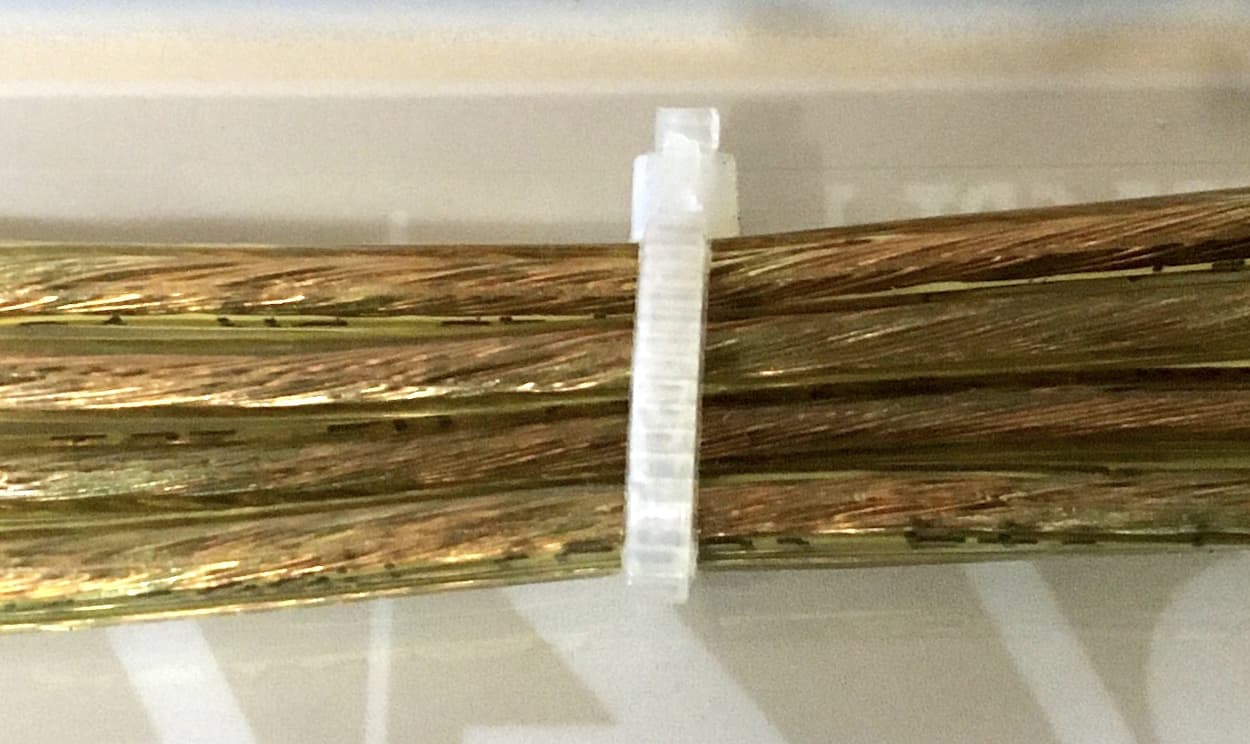
All the negative leads are twisted and all the positive leads are twisted together at each end.
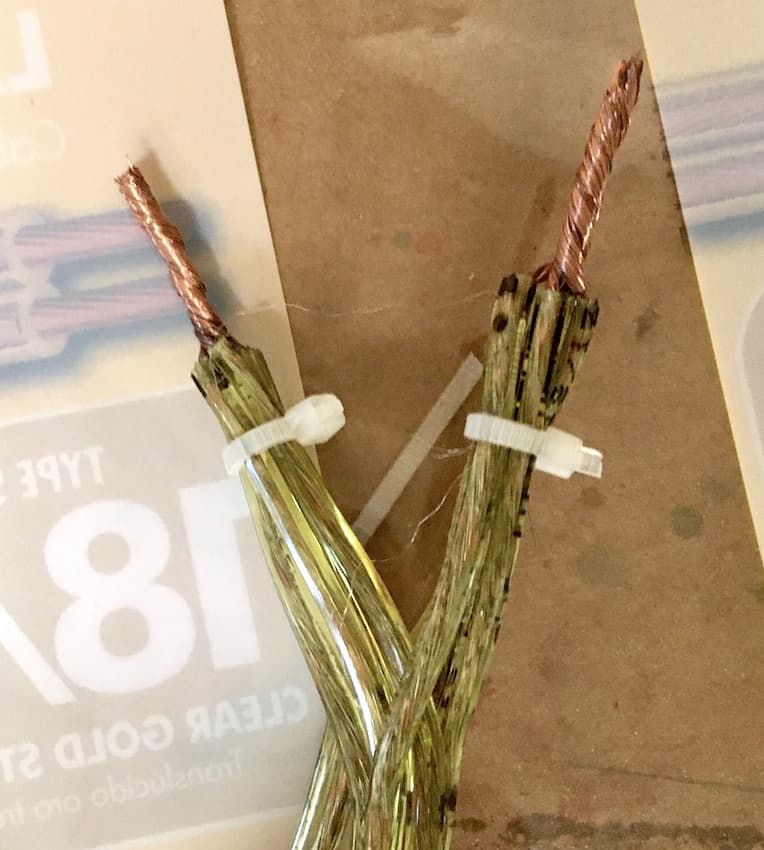
My L/C meter says the stack is 1.1nF between positive and negative.
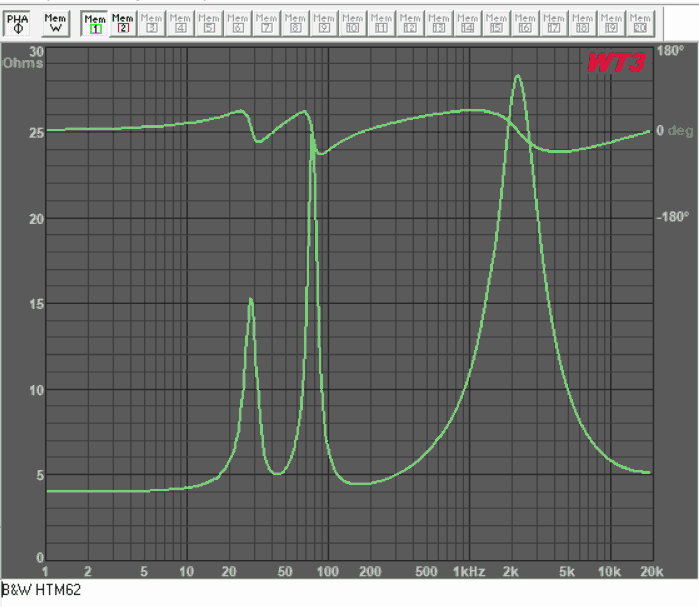
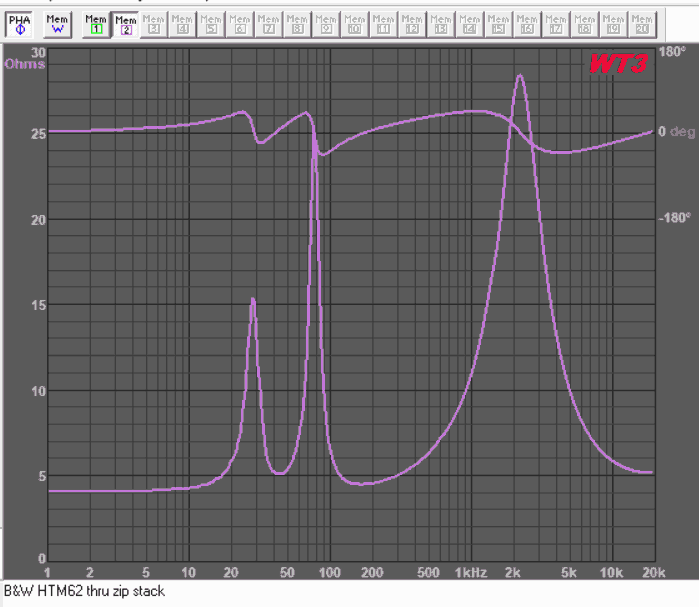
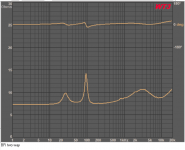
Here we see an impedance plot of a Bowers & Wilkens HTM62 center speaker.
First plot is the WT3 connected to the speaker terminals, the second plot is the same speaker thru the cable stack. All I can see is that the DCR is just a tiny but higher thru the cable. Otherwise I can't see a difference.
The are stacked as flat as is reasonable, but could be tightened up with some more work. I hope this is what you had in mind.
All the negative leads are twisted and all the positive leads are twisted together at each end.
My L/C meter says the stack is 1.1nF between positive and negative.
Here we see an impedance plot of a Bowers & Wilkens HTM62 center speaker.
First plot is the WT3 connected to the speaker terminals, the second plot is the same speaker thru the cable stack. All I can see is that the DCR is just a tiny but higher thru the cable. Otherwise I can't see a difference.
Attachments


Don't tie the cables together. To achieve a RFZ consistant with 1/4 of a single cable, they cannot be coupled magnetically. An inch or two spacing is good enough to decouple, tying them together doesn't do that.
jn
jn
Well darn, that was not easy to do.  Un-bundling them won't be difficult. Keeping them away from each other will be.
The second half of the test is splitting all the pairs, right?
Un-bundling them won't be difficult. Keeping them away from each other will be. The second half of the test is splitting all the pairs, right?
Yes. just allowing the wires to do their own thing basically prevents communication. In essence, just let them lay wherever.
For the divide by with respect to RFZ to happen, the cables cannot be really close. Just letting them get from amp to speaker should be enough.
edit: if you really want to, just measure capacitance and inductance, Z is just math.
jn
For the divide by with respect to RFZ to happen, the cables cannot be really close. Just letting them get from amp to speaker should be enough.
edit: if you really want to, just measure capacitance and inductance, Z is just math.
jn
Last edited:
Would the wires simply need to make a loop to measure their inductance? I.E. connect then together at one end.
Yes, all have to be tied in a short.
Oh, when you go to split the four zips, bundle the 4 positives together and the 4 negatives together, keep the bundles apart. That will maximize the inductance and minimize the capacitance.
To measure that in advance, you could simply take 4 zips and bundle two together as 4 positives, two as four negatives, same number of conductors but physically more like the split ones.
Or, wait until after you did the audibles..
jn
The bundle is now separated into loose pairs. The connections scheme is still the same, each zip wire carries positive and negative and the pairs are joined to each other at the ends. Each pair is spaced approximately 2 inches (50sm) from the nearest neighbor running along the floor.
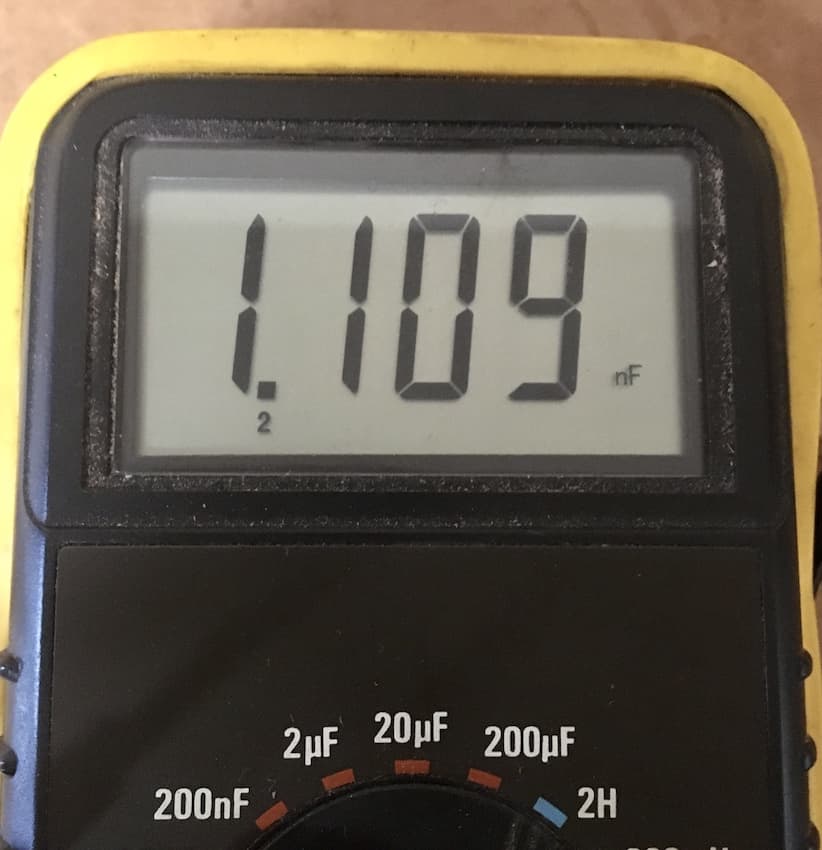
I was not able to measure inductance either bundled or spread. It seems to be below the threshold of my L-C meter. Capacitance went from 1.109 nF to 1.453 nF. Disregard the last digit, it's noise.
I was not able to measure inductance either bundled or spread. It seems to be below the threshold of my L-C meter. Capacitance went from 1.109 nF to 1.453 nF. Disregard the last digit, it's noise.
While I use transmission line theory to calculate the settling time in the tens of microseconds domain (that falls apart after 10's of microseconds), it could just as easily been evaluated using a simple LCR model.
For your speaker, the 78 hz and 2.1Khz peaks will have zero settling time if you use a 25 to 30 ohm RFZ cable. The 5 to 10 ohm midrange band will also have very little settling time as well, the ratio maxing out at 5 to 6:1, represented on my graph by the 20 to 16 ohm impedance which settles to 90% in 1.2 to 1.6 uSec.
If the RFZ of the split zips is 500 ohms, then the peaks are 20:1, settling to 90% at 5 uSec, but the midrange valley is 100:1, settling quite off my chart, the 50:1 hits 90% at about 15uSec, 100:1 I'm estimating at about 20 uSec.. So the midrange settling time is much longer.
Raising the cable RFZ should then cause a temporal shift of the midrange band in the 20 uSec range (granted, to 90%), a delay in the frequencies we are the most sensitive to ITD. The shift at 78hz of 5 usec is meaningless to human perception, we will focus instead on the amplitude and see that content as centered and unmoving..at 2Khz, 5 usec is probably below human discernment as well, but there is a dithering grain of salt there so I cannot say that with full confidence.
My test is designed to look for that delay with respect to the centered image content around the 78 hz peak, as it will shift far less and we are not sensitive to ITD in that band. The 2khz content will also be more time stable, so even if it is within the ITD sensitive range, the shift is far less.
jn
To get closer sim values, use the two RLC models taken from the two cable set RFZ's, and plug them into a sim with that speaker at 78hz, 400 hz, and look for the relative shifts in time.
edit: for a cable with RFZ at 25 to 30 ohms, the total spread in settling time (to 90%) across all frequencies falls below 2 uSec. I would consider this to be below human thresholds. And by not going any lower in RFZ, there is little risk of the phase margin crossing zero when the speaker unloads before unity gain BW of an amplifier. So the cable should not require a zobel.
edit2: for your speaker, the midrange band has the highest RFZ to impedance ratio, so it is expected that that band will be more sensitive to IMD changes with the higher RFZ cable. I would recommend running the IMD tests in the midrange area to see if IMD changes level with the high cable RFZ.
Edit 3: And I want to thank you for taking this effort, regardless of outcome...
Last edited:
You're welcome! Just please let me know exactly what you need as this is new territory for me. I want this test to clearly show what you are looking for.
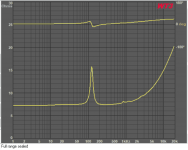
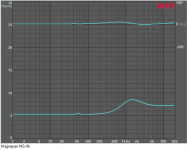
Here are plots for 3 other speakers that can easily be tested. A small fullrange in a sealed box, a cheap 2-way in bass reflex and a vintage Magnepan MG-IIB. If any of these look like good test mules, please let me know.
Here are plots for 3 other speakers that can easily be tested. A small fullrange in a sealed box, a cheap 2-way in bass reflex and a vintage Magnepan MG-IIB. If any of these look like good test mules, please let me know.
Attachments
REW includes several standard dual tone tests for IMD, and also custom frequencies and ratios. We can test just about anywhere you want. Even multitone. I would suggest not going above a sample rate of 96K, as my soundcard isn't as clean above that as below.
I foresee some cherished 'beliefs" utterly dashed here, but not without lots of arguments as to proceedures & resultant "interpretations" of the acquired data.
Too bad Transmission Line Theory doesn't apply in this domain...akin to comparing Light-speed to the speed-of-sound. Good luck all.
--------------------------------------------------------------------------Rick....
Too bad Transmission Line Theory doesn't apply in this domain...akin to comparing Light-speed to the speed-of-sound. Good luck all.
--------------------------------------------------------------------------Rick....
Rick,
You are not the first to misunderstand, and you won't be the last.
You obviously missed (or glossed past) where I stated a T line analysis falls apart when you go past 10 or 20 microseconds.
It has also been proven in the past that a properly done multiple RLC element analysis approaches my t-line results as the number of elements increase.
Perhaps you should read Cyril Bateman's papers. I especially enjoyed when he built a reflection bridge that showed audio reflections in a cable connected to a speaker. I hadn't thought that possible because the wavelengths are so so long.
Edit: Rick, the experiment is being setup in order to either prove or disprove a hypothesis. Nothing more, nothing less. Beliefs "dashed" has nothing to do with it. It is about the possibility of advancing knowledge.
jn
Last edited:
Your first plot, the WT3, is by far the best candidate as it has the low impedance midrange with the highs on either side. A speaker that has very constant impedance through the entire audio band will be useless for this experiment, as nothing is varying.You're welcome! Just please let me know exactly what you need as this is new territory for me. I want this test to clearly show what you are looking for.
Here are plots for 3 other speakers that can easily be tested. A small fullrange in a sealed box, a cheap 2-way in bass reflex and a vintage Magnepan MG-IIB. If any of these look like good test mules, please let me know.
The crux is to find a set of frequencies where the amplifier helps to suppress IMD caused by the speaker, and the high RFZ cable gets in the way of the amplifier doing that. I've no idea what frequencies, but the test signals should be centered in the midrange valley.
jn
Pano, was thinking about it. Perhaps a test signal near but above the 78 hz resonance (maybe 80 or 90 hz), and a second somewhere in the impedance valley. The excursion of the LF will be trying to change the eddy losses of the higher frequency due to pole and front plate conductivity, so that might produce some interesting phenomena that the high RFZ cable is not as well equipped to keep under control.
jn
jn
 It's easy enough to poke around at various frequencies. I'll try a few and post them.
- Home
- General Interest
- Everything Else
- Zip cord for speaker test