Do you habe the Impedanz curve of the driver mounted to your Horn and could post it here? My current test Horn changes the free air peak in this region quite well.
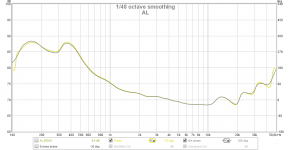
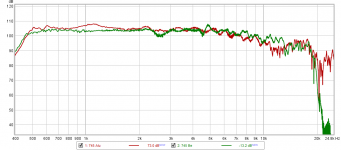
Please find below my most reliable impedance measurement, made by a friend.
An impedance bump is clearly visible above 2 kHz, together with a change in the phase response.
I wonder if this could be an artifact introduced by the pattern of slits in the phase plug?
I am pondering your suggestion of driving it using a current source 😎.
Attachments
I am in doubt If this curve was correctly tracked. The highest Peak should be below 630hz wich is the free air impedance. Look at my Clio curve. The horn damps the peak and shifts it to lower frequencies.
Would you send me your current HF crossover part to hava a look on it?
Would you send me your current HF crossover part to hava a look on it?
I have never measured a compression driver but I would have thought it should be sub 1 ms?
Thanks for sharing. It depends how low in level you want to look. Compare the vertical scales of the plots. The window rise time, duration, etc., also make a difference. I am a newbie too, so perhaps someone with more experience will grab the wav files and comment?
I am in doubt If this curve was correctly tracked. The highest Peak should be below 630hz wich is the free air impedance. Look at my Clio curve. The horn damps the peak and shifts it to lower frequencies.
Would you send me your current HF crossover part to hava a look on it?
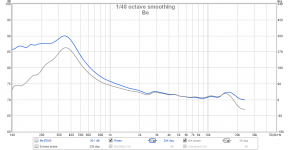
Different diaphragms: Be is lighter and stiffer than Al.
Can be wrong when it comes to real world but for me it looks docali have very fine device that if wanted can be corrected to nearly perfect in minimum phase domain whatever one use analog passive/active or DSP correction, base this because when we look at measured absolute phase verse amplitudes calculated minimum phase then docali have very fine data and only above 25kHz it starts deviate showing storage or other interference, below is phase examles FDW filtered to stay clear of looking at grass.
Measurement chain and calibration can of course be reasons the difference and also docali use 15 ohms dampening.
BTW dampening a double peak can also be done using below Joachim Gerhard recipe in combination using zma-file loaded to free XSim.
Measurement chain and calibration can of course be reasons the difference and also docali use 15 ohms dampening.
BTW dampening a double peak can also be done using below Joachim Gerhard recipe in combination using zma-file loaded to free XSim.
Attachments
Can be wrong when it comes to real world but for me it looks docali have very fine device that if wanted can be corrected to nearly perfect in minimum phase domain whatever one use analog passive/active or DSP correction, base this because when we look at measured absolute phase verse amplitudes calculated minimum phase then docali have very fine data and only above 25kHz it starts deviate showing storage or other interference, below is phase examles FDW filtered to stay clear of looking at grass.
Measurement chain and calibration can of course be reasons the difference and also docali use 15 ohms dampening.
BTW dampening a double peak can also be done using below Joachim Gerhard recipe in combination using zma-file loaded to free XSim.
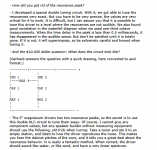
No, in the last measurement I only used a single 8.2uF capacitor in the chain. Concerning the series resistor damping one can find a lot of information provided by Jmmlc here in the forum.
Concerning the "fine" equipment you mentioned. It is not only this what is important. In germany we say "Wer viel misst, misst Mist". 🙂
Who ever wrote an thesis rer. nat. or similar has learned at least to double check equipment and results and do as much verifications as neccessary.
I use REW together with an Focusrite Scarlet Solo at 24Bit/192kHz. I have compared this device with an oscilloscope and an signal generater. Really very good frequecy response. If I remember well it has only 1dB fall-off at 50 kHz. Not long time ago, I measured two new input step-up transformers and recognized some nasty resonance around 40kHz only for one sample. At the end the manufacturer could reproduce it...
For the measurements I use a time reference inside REW. The second output and input works really well for this. So, for every measurement REW can estimate the IR delay and shift. This should nearly be the same as minphase. This is what I did for the measurements posted here.
The power amplifier is a small and low power amp t.amp PM40C. The FR response is within +-1 dB 20Hz to 20kHz. At the end I calibrated the whole amplification chain inside REW (amplitude and phase). The result is a nearly flat reference signal to which - I believe - can be trusted to.
The microphone is another story! I had one of the categry most of us would designate it as cost effective. It was quite cheap and the manufacturer provided a calibration file - what a bargain... I bought it from some specialists which advertized for an value added second "better" calibration. At the end I had two really different calibration files which had considerable difference between them for the same microfone. And I will not talk about phase here... The conflict in my head was which of the two calibration files should be used? At this point there only were two possibilities. Stop measuering or invest in something that can be trusted to. The result was the M23. It is beyond any discussion - at least for me.
The same for impedance measurements. Never had a so easy going than before with respect to this and I started with an resistor, AC meter and Excel several years ago. Bang, bang, every second a reliable impedance curve 😀 Without having a good impedance curve of the drivers mounted into the target loudspeaker it is nealry impossible to design a really good cross-over with less steep filters.
Think you have good points shared there and proof seems reflected in IR file and probably lead to serious very nice performance, what are planned stop bands and slopes for horn and will it be analog passive/active or DSP steered.
The ringing above 20K in this graph looks to me like it is from the DAC or ADC filters as it is very close to 22K which would make sense if the measurement was made at 44.1K.
The impulse measured at 192K does not have that ringing. There is a couple of phase jumps which look like reflections.

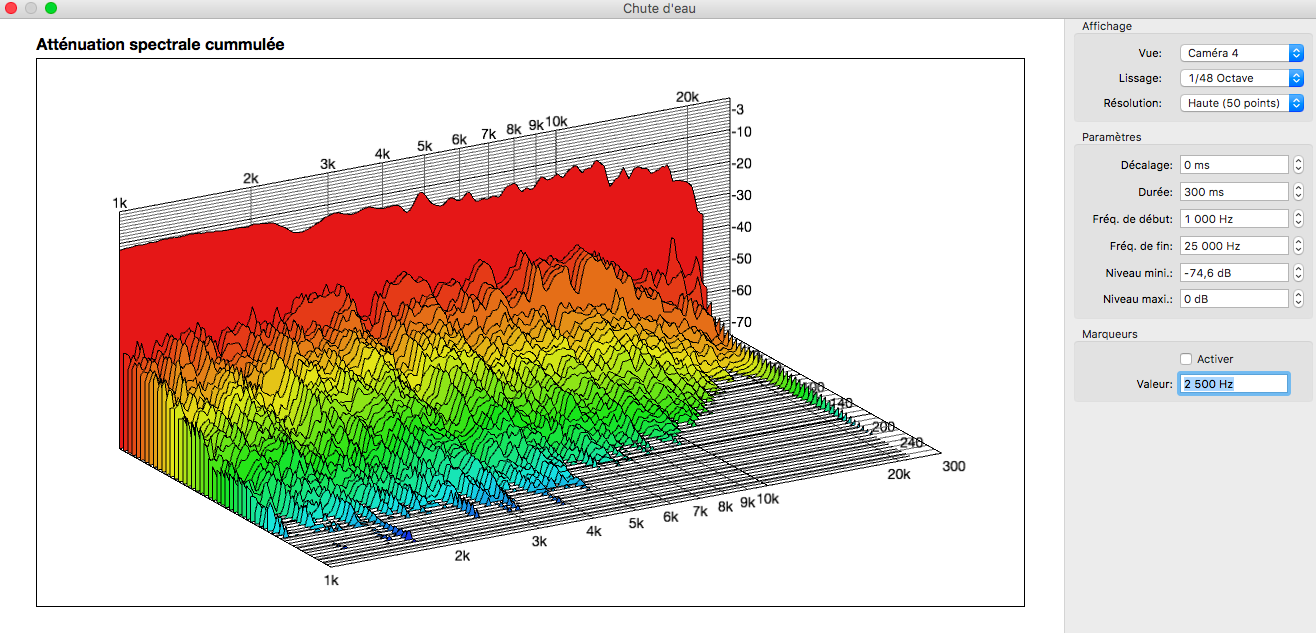
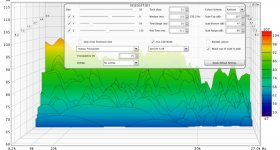
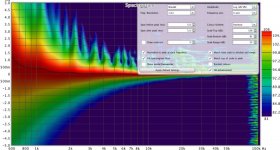
The early waterfall looks quite clean

With settings shown

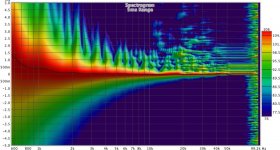
Spectrogram first 5ms

The impulse measured at 192K does not have that ringing. There is a couple of phase jumps which look like reflections.
The early waterfall looks quite clean
With settings shown
Spectrogram first 5ms
Attachments
Thanks Fluid! That's a big help. Wesayso also gave me similar setting to try, which I will.
So you figure the notches up high are reflection cancellations? I used to have a terrible notch at 8.3K on my Altec 288 drivers. Never could figure it out.
A question about your sonogram, what are your settings? It looks like I would expect, but I can't get mine to look anywhere near that.
So you figure the notches up high are reflection cancellations? I used to have a terrible notch at 8.3K on my Altec 288 drivers. Never could figure it out.
A question about your sonogram, what are your settings? It looks like I would expect, but I can't get mine to look anywhere near that.
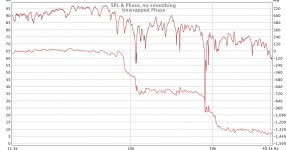
The deep dips with associated sharp phase drops suggests reflections. They are between 18K and 27K so the distances to create those reflections would be quite small.
The phase is remarkably flat to 18K and looks to be a very nice driver.
The Spectrogram settings are close to these I only started using the new REW version today so I don't 100% remember what I used. Change the limits to get the same frequencies shown and it should be close. Changing amplitude to Lin%Peak or Lin%FS gives graphs that look normalised.
Attachments

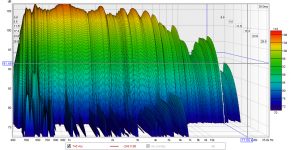
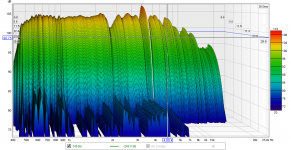
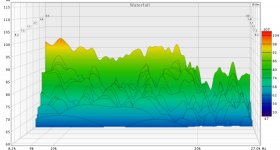
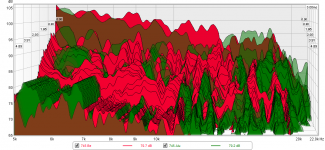
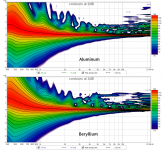
Here is another look at the aluminum and the beryllium impulse files. Remember that these are different horns. I limited these to 22K because the beryllium measurement was done at 48K.
On the left image you'll see a waterfall of the top end with the two measurements overlaid. If you see a higher level one on than the other going forward in time, don't forget that the initial level may be higher, too.
The other is a normalized spectrogram of each. In this all levels are the same. Contours are at 2dB, which may help. Honestly I can see that one of these is really better than the other, and my guess that the aluminum rings at the top isn't easy to see, if it actually exists. Maybe not.
Attachments
Pretty noisy drivers!! too bad they are in different horns. The comparison probably doesn't mean too much though seeing the radian diaphragm mount is so erratic (bad!) and different horns. I like to look at fh to 5K most with upper mid compression drivers - 5k up is more for treble horns - I find be can settle fast (JBL 2435) but tends to have high high order distortion that gives illusion of "better detail" to some people
Can you show us "quiet" drivers using the same plots? Or maybe post the impulse files here so they can be directly compared.
- Home
- Loudspeakers
- Multi-Way
- Beyond the Ariel