Aftermath
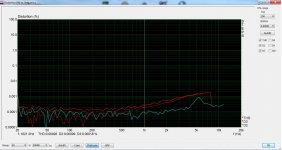
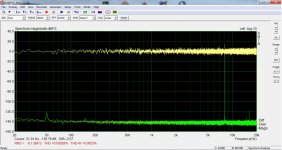
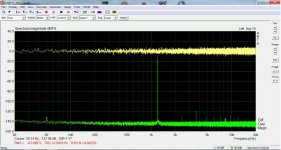
It does better when shielded in the chassis! Sensible. See first two pics. Also, it does different from PC to PC. Third pic is on my dedicated audio PC -still a win7 machine but striped to the essential.
It doesn't like the USB ports to the rear of desktops. Ground loop issues. It prefers the front panel ports on both PCs. When moved from front to rear port for the first time, it reinstalled drivers automatically.
Full scale 0dB not reached. Better to keep it at -8dB. This is 360mV RMS at the line out. I may have to look at the output stage too.
It is stable at 44.1 and 48kHz but very unstable at higher sampling rates. Not usable at 192kHz. That is with ARTA. Not a problem for me though. I recorded at 192kHz with audacity and played back with foobar and there was no problem at all.
Attachments
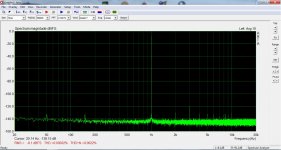
It does better when shielded in the chassis! Sensible.
E-MU 0404 USB has a conducting paint on the inside of the plastic box (resistance across the box about 30 ohm). I taped the case inside with copper tape completely, resulting in no change in noise. The paint is a very clever solution. For DIY the copper tape is simple and low cost.
It doesn't like the USB ports to the rear of desktops. Ground loop issues.
I do not understand - how can a ground loop arise in soundcard loopback? There is no other ground involved. Perhaps noisy USB power?
When moved from front to rear port for the first time, it reinstalled drivers automatically.
Windows do that, driver is installed for combination device vs. port. I have no idea why.
It is stable at 44.1 and 48kHz but very unstable at higher sampling rates. Not usable at 192kHz. That is with ARTA.
By unstable do you mean arta corrupting the spectrum/averages every few seconds? That is a problem of too short interrupt period. There are quite some calculations involved and at 192kHz Arta does not always make it on time for the next period. In linux this is improved/fixed by increasing the period length (e.g. from 20ms to 200ms). Usually no such setup available in windows as such configuration would have to be provided/offered by the driver.
Thanks for the explanations! By "ground loop issues" I mean 50Hz peaks and its harmonics. I guess noisy usb describes it better. You are also right spot on wrt the high sample rate instability.
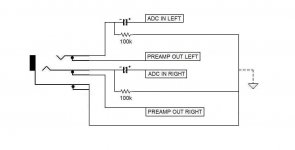
BTW, there is an error in post #16 in the jack wiring schematic. The drain resistors should be before the capacitors. I'm posting the corrected schematic.
BTW, there is an error in post #16 in the jack wiring schematic. The drain resistors should be before the capacitors. I'm posting the corrected schematic.
Attachments
I haven't a suitable battery or a usb isolator at the moment, but you gave me the idea to try an external linear and floating psu based on LM338. I had used this earlier while chasing the high frequency peak and since it didn't help, I put it aside. Now that I've cleared up the picture I can see different things. First, it doesn't do anything to the -already small- 50Hz peaks neither improves the overall noise level. But the high frequency peak goes up again! It makes me think that the Vcom buffer modification just tuned something for cancellation. Something coming from the usb (data?) line. @1audio said it works at 8kHz. It fits!
You may want to use a testing signal which is non-integer multiple of 1kHz as that is USB frame freq for fullspeed and 8kHz for highspeed. Then you can easily distinguish between distorting harmonics (multiples of your fundamental) and noise peaks.
Also REW will mark the harmonics for you, REW usage is basically same as Arta for spectrum measurement.
Also REW will mark the harmonics for you, REW usage is basically same as Arta for spectrum measurement.
Last edited:
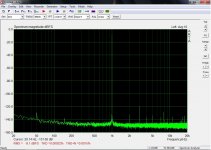
I tried many random frequencies. It doesn't seem to affect the "peak" in a way other than the expected IMD side bars. It's easy to distinguish the "peak" even if it's hidden in other harmonics. I described it at post #2. I attach a measurement with signal frequency at 8.1kHz right on the "peak" and I can find it underneath.
I'll have a look at REW!
I'll have a look at REW!
Attachments
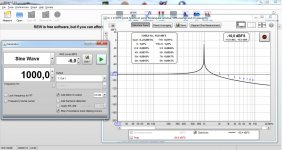
I downloaded REW yesterday and I'll need some time to find my way with it. At the moment, the only way to make it work is to check "lock frequency to FFT". I don't know what it really means. I haven't seen that in ARTA. First impression is that REW allows for more detailed measurements but the configuration is not for beginners.
OK! I got some graphs by just sniffing around. First pic is the best I could do so far. "Lock frequency to FFT" checked. The "peak" is between 7 and 8 harmonics. REW doesn't give it a name or measurement. Second pic is the "peak" alone. Third pic is with "lock frequency to FFT" unchecked.
Attachments
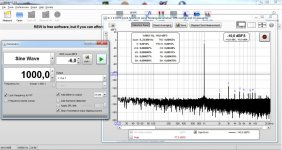
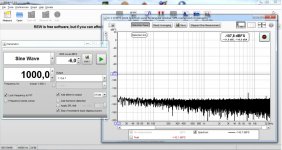
Lock frequency to FFT means REW adjusts the generator frequency so that it is an FFT bin centre. That means it is periodic in the FFT length and can be analysed without a window (or with a Rectangular window, which is the same thing). If the test signal is not on a bin centre (or an external generator is being used) a window must be used, such as Blackman-Harris 7. Your third plot shows the effect of using a Rectangular window with a signal that is not periodic in the FFT length.OK! I got some graphs by just sniffing around. First pic is the best I could do so far. "Lock frequency to FFT" checked. The "peak" is between 7 and 8 harmonics. REW doesn't give it a name or measurement. Second pic is the "peak" alone. Third pic is with "lock frequency to FFT" unchecked.
John, are you sure that the third plot is effect of the disabled FFT tracking? I always get that chart when discontinuity of input data occurs (e.g. switching fft option + resetting generator, or buffer underrun, or java does not make the calculation in time for new data in 192kHz), must reset the averaging to get back to proper result. I never use the FFT tracking checked.
Yes, that's how rectangular windowing looks on non-periodic signals. A signal interruption would have a similar (though transient) effect. Locking the generator to the FFT length allows maximum frequency resolution by using a Rectangular window so no window spreading.John, are you sure that the third plot is effect of the disabled FFT tracking?
Lock frequency to FFT means REW adjusts the generator frequency so that it is an FFT bin centre. That means it is periodic in the FFT length and can be analysed without a window (or with a Rectangular window, which is the same thing). If the test signal is not on a bin centre (or an external generator is being used) a window must be used, such as Blackman-Harris 7. Your third plot shows the effect of using a Rectangular window with a signal that is not periodic in the FFT length.
Hi JohnPM,
The more I use REW the more I appreciate it, great work! Indeed, using Blackman-Harris 7 doesn't require to lock frequency anymore. So, I had my first IMD measurements. It tells you all harmonics with numbers and it leaves aside any artificial peaks not related with the signal. This is a great feature IMHO. REW stays!
- Home
- Design & Build
- Equipment & Tools
- Behringer UMC 202HD for measurements