What exactely does the plot displays?
The THD of the filter applyed to a 0DBFS sin of frquency f (as function of f)
or
the THD of the filter (with multiplier) applyed to the upsampled 0DBFS sin of frquency f?
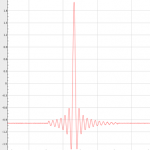
In my case this is just the filter applied to a one sample impulse.
The peak disappears completely when the combined FIR1 + FIR2 (distortion is a flat line @ -800dB) are analysed by the same method so I'm a bit skeptical of it's value...
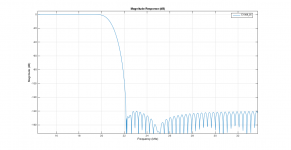
Just having a mess around with Peter Craven's cos^10 windowing function.
This is still linear phase, and has a null a 2-3hz below nyquist. It's -6dB a 20kHz but the roll-off is limited to above about 19kHz.
Once I get this sorted a bit better I'll post up more details, but at this stage it's "as is" and "for listeners only"...
This is still linear phase, and has a null a 2-3hz below nyquist. It's -6dB a 20kHz but the roll-off is limited to above about 19kHz.
Once I get this sorted a bit better I'll post up more details, but at this stage it's "as is" and "for listeners only"...
Attachments
Interesting. If I'm not mistaken, the gain on this filter is around 1-3dB down on the latest C960 filter? Initial thoughts, after adding 3dB to the preamp volume control, the C960 is tiny bit 'more open', perhaps a little more dynamic? Surely I am not hearing the 6dB roll-off at 20k? For me now, the biggest weakness is lack of focus in the soundstage. It feels a little muddled somehow and not up to my analogue set-up. I doubt this is due to filters, likely the dac itself, perhaps it is time to swap the 0.05 board I'm using for prototyping and testing for the 0.01? Think I should try moving the speakers a few inches too, often works wonders.
Yes, impulse you see is what comes out of DAM add to measurement board with ADC filter.Interesting, but it makes me wonder how much impact the ADC is having on the impulse response?
NOS measure also had ringing.
The newer C960_140dp is pretty darn good, gone is the funkiness in lower treble that made me say about the previous 960 that it was not coherent sounding, easily rivaling or even besting my favorite C128_100dp. The C960 has perhaps a tiny bit of grain/sand in two last octaves, but at least it is resolving there, unlike C128, which while very resolving in bass and midrange has some things washed out in top octaves. This can be good or bad thing right now for me.
ct1014_60 does not compete right now in my system, less resolving and a bit veiled, loudness matched and etc.
ct1014_60 does not compete right now in my system, less resolving and a bit veiled, loudness matched and etc.
That said the filters will contribute to the distortion characteristics but won't effect the harmonics of the main test tone.
What oneoclock's plots don't show is the peak in distortion around 11-12kHz that all the filters except NOS display.
44100 Hz sound has 2nd harmonic distortion to 11,025 Hz. and below. 3rd harmonic distortion to 7350 Hz harmonic and below.
I correct. 12 kHz. makes no sense if you measure sampling at 44100. The program can not make this. I make this measure with another device to see if it happens at 12 Khz.
Any nonlinear mathematical filter operation produces harmonic distortion.
But most of harmonic distortion is R2R tolerance.
Last edited:
One thing is weird, squarewave bass (Pucifer - Toma) has different presentation spatially between C960 and C128. C960 projects the sqw bass higher in the center in soundstage. The 2dB difference at 15kHz won't have as stark effect?!
It is one of my test stones in evaluating gear, if sqw bass is 'detached' sounding, then there is a problem (phase problems). I have hard time telling which filter does it more correctly, though.
I tried the stock filter and NOS as well for data points and to not drift too far into placebo, these new filters have come truly long way, that is for sure.
In the quest for the "fs/4-peak" I computed the convolution of a sin() signal of frequency f with the FIR1 filter. Then I looked at the maximal absolut value of the resulting sequence. I did this for different phase shifts of the sin, as the samples of sin then differ slightly. I did that for a sin() with fs=8*44100Hz and for a sin with fs=44100 which was then 8-fold oversampled. The graphs of that where a bit surprising (for me).
Also there is something special for f=44100/4Hz, but I am not yet sure how that could explain the "peak".
First observation, the oversampled and non oversampled case differ (by a very small amount) in general, more visible for low frequency and when the roll off starts
Here an example of C128_100dp and C960_140dp at 20Hz.


Second observation, while for the C960_140dp difference disappears quickly (at 200Hz it is no longer visible) for the C128_100dp it remains. Moreover the oversampled case with the C128_100dp has its maxima over 0dB, so is clipping slightly, while the non-oversampled is not clipping.

Third observation, for f=44100/4Hz the variation with the phase is much bigger than usual ... is that the cause for the peak?


Fourth observation in the roll off area only the non oversampled case rolls off (remeber we see only the maxima not all samples)


After some headache, I figured out this is no bug but a feature ... of the Nyqvist filters.
We know Nyqvist filters preserve on oversampled signals the original samples. If f is no or not near a big integer divisor of 44100, more or less all values of the sin function will appear as sample, so especially 1 (=0dB), and will be preserved by the Nyqvist Filter.
Compare with IPv4_p35, the oversampled case also begins to drop, not as fast as the non oversampled, but definitely does not stay at 0dB.

It remains to understand if the bigger variation at 44100/4Hz is cause for the peak and if yes to explain that variation.
Here the Octave code used to make the graphs:
Also there is something special for f=44100/4Hz, but I am not yet sure how that could explain the "peak".
First observation, the oversampled and non oversampled case differ (by a very small amount) in general, more visible for low frequency and when the roll off starts
Here an example of C128_100dp and C960_140dp at 20Hz.
Second observation, while for the C960_140dp difference disappears quickly (at 200Hz it is no longer visible) for the C128_100dp it remains. Moreover the oversampled case with the C128_100dp has its maxima over 0dB, so is clipping slightly, while the non-oversampled is not clipping.
Third observation, for f=44100/4Hz the variation with the phase is much bigger than usual ... is that the cause for the peak?
Fourth observation in the roll off area only the non oversampled case rolls off (remeber we see only the maxima not all samples)
After some headache, I figured out this is no bug but a feature ... of the Nyqvist filters.
We know Nyqvist filters preserve on oversampled signals the original samples. If f is no or not near a big integer divisor of 44100, more or less all values of the sin function will appear as sample, so especially 1 (=0dB), and will be preserved by the Nyqvist Filter.
Compare with IPv4_p35, the oversampled case also begins to drop, not as fast as the non oversampled, but definitely does not stay at 0dB.
It remains to understand if the bigger variation at 44100/4Hz is cause for the peak and if yes to explain that variation.
Here the Octave code used to make the graphs:
Code:
pkg load signal;
format long # print more digits
global fs=8*44100;
f= 12000; % frequncy of the sin test tone
fir1= dlmread("/path/fir1_C128_100dp.txt");
ti=round(fs/f)+length(fir1) % lenght of convolution of FIR and one period of sin
t=ti*16 ; # nr samples of the sin function (in the not upsampled case)
ap=200; # number of divisions in phase shift

function rdb = db(H)
% dB
rdb= 20*log10(abs(H));
end;


% time of i-th sample (non oversampling case)
for i = 0:t
x(i+1) = i/fs;
endfor

% divisions of phase shift in [0,pi]
for i = 1:(ap+1)
ps(i) = pi*(i-1)/ap;
endfor

%non oversampling case
% compute convolution of the sin of frequency f with pahseshift ps(i) with the FIR filter
% discard beginning and end of the result, to get rid of the margin effects
% store the max absolute value of the sequence
for i = 1:(ap+1)
r=conv(sin(2*pi*f*x +ps(i)),fir1);
lr=length( r);
dms1(i)=max(abs( r(ti:(lr-ti)) ));
endfor

% time of i-th sample (oversampling case)
for i = 0:(t/8)
u(i+1) = 8*i/fs;
endfor

%oversampling case - description see above
for i = 1:(ap+1)
r=conv(upsample(sin(2*pi*f*u +ps(i)),8),fir1);
lr=length( r);
dms2(i)=max(abs( r(ti:(lr-ti)) ))*8;
endfor

% print the max absolute values of the sequences as function of the phase shift
plot(ps,db(dms1),'g',ps,db(dms2),'r')
xlabel('Phase shift (rad)');
ylabel('max absolute value of amplitude(dB)');
h=legend ({'normal. ', 'upsampeld. '}) ;
title ('sin(f)*FIR1, for f= 12000 Hz, FIR1= C128_100dp' );
grid('on');Thanks zfe!
I'll have to re-read that a couple of times to get my head around all that information.
I've observed that the centre frequency of the peak appears to vary with the type of filter used. The cos^10 window moves the peak to 10kHz for example. The C128 and C960 use a Chebyshev window and the peak is close to 11.025kHz.
The other factor is the steepness of the filter roll-off is related amplitude of the peak. I'd hazard a guess that the area under the peak is the same for the C128 and C960. The C128 has a lower peak but the frequency spread is far wider.
FWIW I've found the Nyquist filters are basically a raised cosine filter with fc = fs/oversampling rate.
Yes, impulse you see is what comes out of DAM add to measurement board with ADC filter.
NOS measure also had ringing.
I think we need to be a bit careful how we interpret sound card tests using impulses.
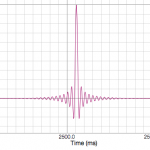
The C960_140 impulse you posted after processing via your ADC and fuzzmeasure looks like this:
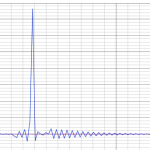
I've hooked up my Bitscope Micro and measured the output at the +/GND on the XLR connectors.
The bitscope was using Enhanced mode which gives highest bit resolution. Sampling rate is 5MHz which isn't the best.
The capture is truncated due to triggering and the resolution of the Bitscope. The display is offset by about -0.9v, mainly so I could zoom in on the area interest on screen.
This shows the 1 sample impulse played via iTunes -> USB -> Amanero, then processed with C960_140 filter installed on the DAM:
And finally the C960_140 + FIR2 impulses processed against the same test signal using SoX, which is my usual method.
You can see that the characteristics of the filter impulse response and the impulse response at the DAC output in my tests are broadly similar, which isn't too bad given the abilities of the Bitscope. On the other hand the impulse you've posted looks as though it results from another filter all together.
You could probably improve the quality of the results you are getting by upping the sample rate of the ADC to minimise the influence the ADC internal filters on the DAC output. Although this means feeding the DAM at 44.1 and setting the ADC to a higher rate which isn't usually possible if you are running the DAM from the SPDIF of the same sound card.
TBH this is why I prefer to work with the impulse response of the filter coefficients themselves. Anything else adds too many variables to the equation.
cheers
Paul
Last edited:
One thing is weird, squarewave bass (Pucifer - Toma) has different presentation spatially between C960 and C128. C960 projects the sqw bass higher in the center in soundstage. The 2dB difference at 15kHz won't have as stark effect?!
It is one of my test stones in evaluating gear, if sqw bass is 'detached' sounding, then there is a problem (phase problems). I have hard time telling which filter does it more correctly, though.
I tried the stock filter and NOS as well for data points and to not drift too far into placebo, these new filters have come truly long way, that is for sure.
This is from wikipedia showing the odd harmonics of 1kHz square wave

The HF roll-off will alter the character of the square wave bass by altering it's upper harmonics.
Off Topic
A remark on the the dead picture links in the posts:
There seems to be a bug in the web-forum software.
If you crate a post, preview it, click in the preview on the attached pictures to view them big, and then go back to preview, the picture links are dead.
The only solution (I found) is to upload and place the new uploaded pictures again.
In short: thou shalt not click on the attachments in preview!
Claro!
TBH this is why I prefer to work with the impulse response of the filter coefficients themselves. Anything else adds too many variables to the equation.
missing imgs....
a) oneoclock impluse
b) filter coefficents upsampled in SoX then viewed in Fuzzmeasure
c) Bitscope capture of XLR output at 5MHz sampling rate
Attachments
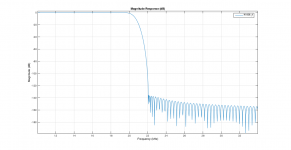
The CT1014 is basically a brick wall filter, with a slightly gentle rolloff. Plot of CT1008 is essentially the same as posted filter.
Attached are two variants with Kaiser and Chebyshev windows. The aim is to have around 100dB attenuation at Nyquist.
I suspect there is a bit to be gained by the added stop band attenuation.
There isn't much between the filters. I think the deeper attenuation of the stop band might make the LF sound slightly more open. There is more roll-off with the CT1014 above 19kHz, otherwise....
Goal of all the above is to eliminate the imaging around Nyquist as far as possible. I was also checking for colouration that might be attributed to the window functions. I don't think there is much to pick between them. Interested to hear constructive comments.
Attachments

Last edited:
Approaching the filter distortion from the other side ... theory says the result of a linear operation on a sin wave is again a sin wave of same frequency (but possibly other phase and amplitude). Upsampling and FIR and IIR filters are linear. Thus in the ideal world there is no filter induced THD.
I the real I thus see three sources for an filter induced THD.
1. The quantization make that the sampled sin() is not exactly a sin(). There might be a frequency depended effect on how much the quantization errors influence the deviation from the ideal result. Due to linearity
Filter(signal+error)=Filter(signal)+Filter(error)
As Filter(signal) contributes not to the distortion, the distortion is due Filter(error).
If now fs =n*f , with n an small integer, f the frequency of the sin(), then the sin() is only sampled at only n different places, thus you have only n different values of errors, which are repeated. This may show a different behavior than the standard case which is the following:
If fs/f is far from being integer, sin() gets sampled at manny different places, thus in that case you may safely assume that the error is random. You get then as estimate of |Filter(error)|~ average(quantization error)* sqrt( Sum coefficients^2 ).
The filter eror amplification, sqrt( Sum coefficients^2 ), is the quare root of area under the squared impulse response, Thus narrower peaks have less.
Remark: quantization of the filter coefficients does not harm in this context, as it is still a linear filter (with other coefficients).
2. arithmetic issues in computation of the distortion, eg. Fourier transform is less (rounding) error prone than the convolution (when done with the same datatype).
3. The filter my produce results greater than FS for some frequencies. If your computation takes this in account, that clipping gives you an harmonic distortion.
@oneclock
to circumvent the lack of harmonics for frequencies >fs/4, you find in data sheets for that area the distortion computed based on the intermodulation distortion of two frequencies close to fs/2. Perhaps you want to try this.
Last edited:
I tried the stock filter and NOS as well for data points and to not drift too far into placebo, these new filters have come truly long way, that is for sure.
I hadn't listened to the stock filter for a couple of months, so thanks for the reminder. It is definitely worth having a listen just as a reminder of what we were trying to fix in the first place.

This is from wikipedia showing the odd harmonics of 1kHz square wave
The HF roll-off will alter the character of the square wave bass by altering it's upper harmonics.
No doubt the fr response is a small part, but few dB tilt is not nearly enough effect, ime to make such differences in perceived performance in sqw-s. I have too little knowledge in this signal-analysis-math wizardry to know better, but it feels like phase problems might contribute to this, however these are manifested.
Coherent sounding vs incoherent sounding setups in analog or mechanical ways have somewhat similar flaws as one digital source vs another. I might be wrong tho, i'm here to learn 😱
- Home
- Source & Line
- Digital Line Level
- Filter brewing for the Soekris R2R