Can you show an example?diaphragm breakup on the impedance plot.
My first impression is that the saw teeth look like a measurement artefact
That was my impression too.... the saw teeth look like a measurement resolution that's just too fine to be real ???
Yes that is exactly what I...
At least we all had the same idea.
Thanks to DT for the information about his own checks.
Rather mysterious, I would be extremely keen to compare the same driver on a horn and on a plane wave tube, to see where it comes from.
Anyone with a PWT and an AP or similar hi-resolution system who can test this?
Best wishes
David
My first impression is that the saw teeth look like a measurement artefact - noise, truncation, FFT bins, whatever.
Are they consistent and repeatable?
Absent for a direct radiator with the same test set up?
Best wishes
David
My guess would be noise, PC fan etc, horn doing it's job in reverse.
Thanks for the Thread topic, Patrick. I like the "First Millisecond" idea, perhaps a nice name for a waveguide company? 🙂
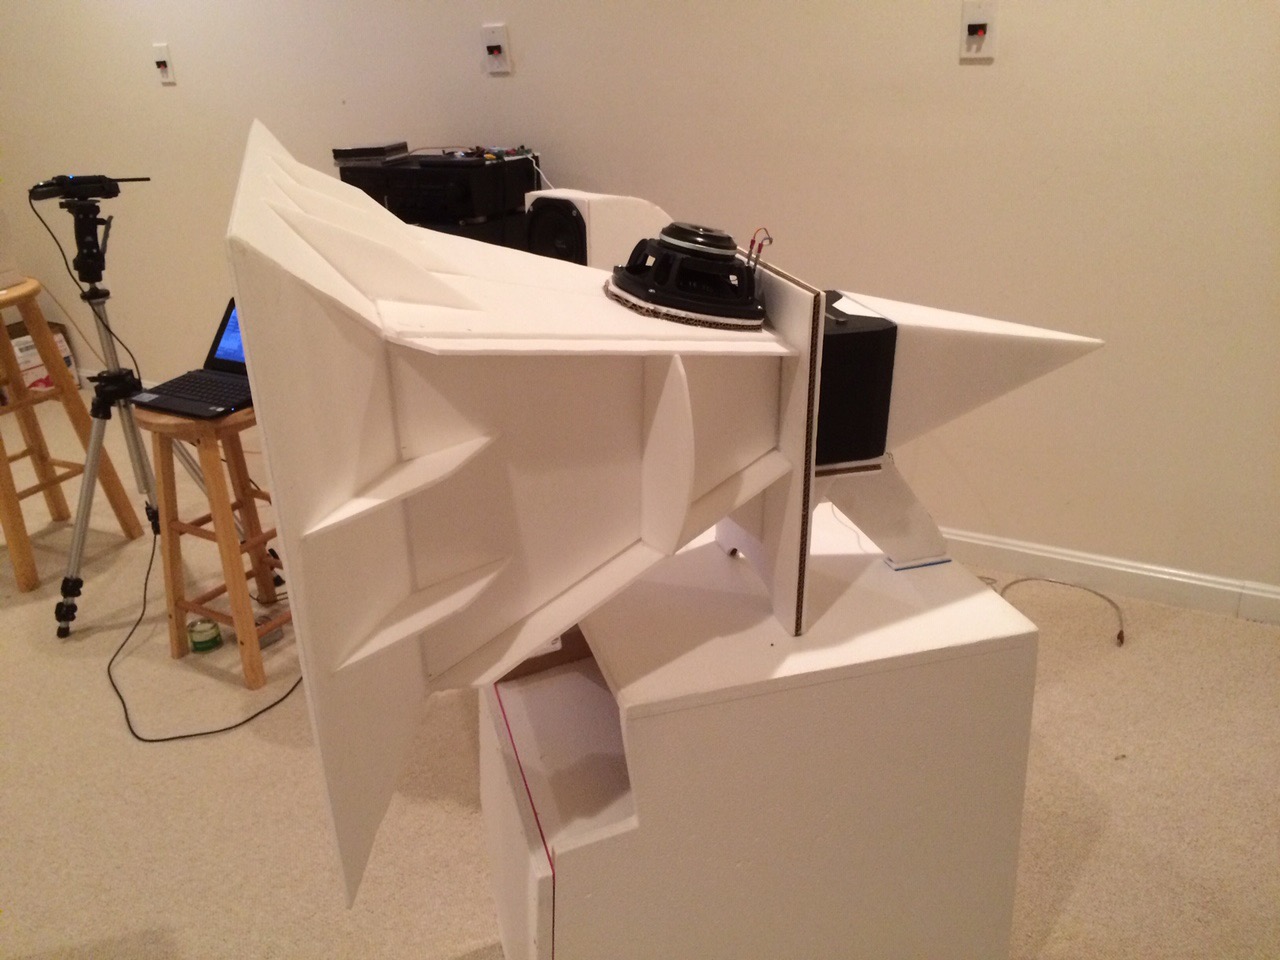
I agree that the first few msec are important and the time I spent using modeling clay/putty to shape a smooth transition from the exit aperture of the AMT tweeter to the main horn wall in my AMT Synergy, made all the difference. This was done with a mic and REW and making measurements after each little dab of putty. The difference was quite staggering.
I agree that the first few msec are important and the time I spent using modeling clay/putty to shape a smooth transition from the exit aperture of the AMT tweeter to the main horn wall in my AMT Synergy, made all the difference. This was done with a mic and REW and making measurements after each little dab of putty. The difference was quite staggering.
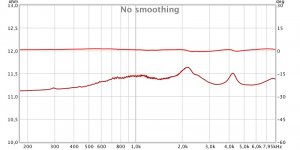
I just measured a driver and attached an impedance plot...
What did you use as software and hardware?
What is the driver?
Best wishes
David
REW, MacBookPro, RME Fireface, Dr. Jordan microphone. Goto 370DX on Autotech Le Cleac'h Iwata 300 horn. I did 6 sweeps, they all look the same, I have not seen this with another combination.
Maybe yes, maybe no....
Impedance or frequency graph has no time information. HOM and their relatives (any other type of reflections) are generally delayed to desired signal, therefore have a time delay. A peak (null) on an impedance or freq. plot might be easily correctable (most drivers are minimum phase) or not, if the anomaly is due to a resonance or similar problem.
Impedance or frequency graph has no time information. HOM and their relatives (any other type of reflections) are generally delayed to desired signal, therefore have a time delay. A peak (null) on an impedance or freq. plot might be easily correctable (most drivers are minimum phase) or not, if the anomaly is due to a resonance or similar problem.
schiirrn, can't say for sure, but was there a lot of midband noise in the room when you made that plot (like a fan or air conditioner)? One thing to keep in mind is that speakers are also microphones so if anything is shaking it's diaphragm it will look like hashiness on the impedance curve. Have you tried raising or lowering the test signal levels, if ragged stuff goes in opposite direction, that would indicate poor S/N in the measurement.
There are some phenomena described in this paper that look a lot like that ripple. Skip to page 5. https://www.grc.com/acoustics/an-introduction-to-horn-theory.pdf
Oh how the times have changed on this forum. For years I been asking for some sort of measurement that shows the existence of HOMs or their audible effect - to no avail. And yet people chased them and tried to avoid them again and again.
Horn edge diffraction is real, can be measured and heard. Mr. Iwata was doing interesting work on this 40+ years ago.
HOMs are still the Bigfoot of audio. They are out there somewhere - we want to believe. 😀
Horn edge diffraction is real, can be measured and heard. Mr. Iwata was doing interesting work on this 40+ years ago.
HOMs are still the Bigfoot of audio. They are out there somewhere - we want to believe. 😀
In my "Homster" thread, the existence of HOMs was easily seen. Filling the horn with reticulated foam accomplished the following:
1) much cleaner impulse response
2) smoother frequency response
3) subjectively, it sounded less fatiguing
The thing about the foam is that it works more noticeably on a flawed horn. The horn I treated had a 90 degree reflector in the throat and the body is basically a giant diffraction slot.
1) much cleaner impulse response
2) smoother frequency response
3) subjectively, it sounded less fatiguing
The thing about the foam is that it works more noticeably on a flawed horn. The horn I treated had a 90 degree reflector in the throat and the body is basically a giant diffraction slot.
Instead of dampening the horns with foam, use a proper L-pads in the crossover to dampen the sound. I run 4-way speakers with mid horn, high mid horn, horn tweeters, and 2-15" vintage W.E. woofers.
The "speakers" disappear and with your eyes closed, you cannot tell if it is a live performance or not.
Dampening horns with foam... what's the point of having horns!?
Just my 2 cents opinion
The "speakers" disappear and with your eyes closed, you cannot tell if it is a live performance or not.
Dampening horns with foam... what's the point of having horns!?
Just my 2 cents opinion
Maybe. But usually on this forum it's taken to mean modes created inside the horn itself, not at the edges. Although that definition seems to have slid a bit over the years.Yes it is. Maybe it also a HOM?
Currently I'm working with 2" BMS drivers on a 1.4" Altec multicell horn. That should be a horrendous heap of HOMs. If it is, I don't know how to hear or see them. Maybe in the FR or the decay?
For my purposes I don't classify them by their source. That is to say, they are all of some interest when designing a horn. Anyway..
So, are you referring to the modes that develop when the horn doesn't match the output of the driver?
So, are you referring to the modes that develop when the horn doesn't match the output of the driver?
Hello,
Higher Order academics use Higher Order words to author Higher Order papers, for example Higher Order polynomial and Higher Order Differential equations. Now we are on a roll.
In horns (including the subset waveguides) have hard reflective surfaces some have sharp, others have smoother rounder diffusion slots. The reflections or diffused sounds take a longer path and a longer time to traverse the length of the horn. These reflections and diffused sounds are audible. This is the stuff of the hypothetical construct called HOM.
GedLee tells us that the OS horn has fewer HOM’s because of its geometry. Plus he tells us the acoustic foam is positioned in the length of the horn to attenuate the previously reduced level of reflections and diffused sounds that would otherwise linger.
That is all there is to HOM, the rest is hype and marketing.
Thanks DT
Maybe. But usually on this forum it's taken to mean modes created inside the horn itself, not at the edges. Although that definition seems to have slid a bit over the years.
Currently I'm working with 2" BMS drivers on a 1.4" Altec multicell horn. That should be a horrendous heap of HOMs. If it is, I don't know how to hear or see them. Maybe in the FR or the decay?
The best tool is a high resolution impedance plot.
All of those reflections and diffractions show up as ragged edges on the plot. If it sounds harsh it will show up on the high res impedance Plot.
DSP does a reasonable job of removing the phase delays and nasty Frequency Response.
Thanks DT
Alas my WT3 isn't supported anymore, and my Woofer Tester II is out on long term loan. So no high resolution impedance plots for me. 🙁 Decay and the spectrogram look OK. And sine sweeps are about the cleanest I've heard (distortion measurements say otherwise).
In Patrick's Homster thread he did a good job of showing edge diffraction artifacts. I had an earlier thread with crude measurements of the old towel trick. But those are not Higher Order Modes, at least not by the definition given in the thread.
In Patrick's Homster thread he did a good job of showing edge diffraction artifacts. I had an earlier thread with crude measurements of the old towel trick. But those are not Higher Order Modes, at least not by the definition given in the thread.
- Status
- Not open for further replies.
- Home
- Loudspeakers
- Multi-Way
- Why do HOMs Suck?