Unfortunately as DIYers, that's all we can afford. REW is not the same as professional grade measurement equipment but I don't think it's so bad that the measurements are false.
However, I'll be happy to re-run my measurements if you can provide me with the professional grade hardware and software.
You don't need pro gear for measuring accurate timing and timing difference. Just trash equipment which prevents dual channel measurement, and purchase common 2ch sound card with phantom power, loop cable and traditional measurement mic. REW is okay after that also for timing measurements, though it's still worse for speaker engineering than e.g. ARTA (which is not pro software either). Without dual channel gear there is no guarantee that measured timing difference is correct and repeatable, though all settings are kept unchanged. I've tested this quite recently with REW and Umik-1.
I'm not entirely surprised that I should also purchase some tools for the poorest diyers, but my work of few thousand hours to produce freeware speaker simulator must be enough. I just wish that you avoid provocative lecturing until information is more reliable - not flaming with opinions.
Could you post an early waterfall plot using these settings?

That would show the hand-off from one driver to the next.
Hi wesayso
Thank you for your assistance. I'm just a hobbyist. All help is appreciated. I have no problem being wrong.
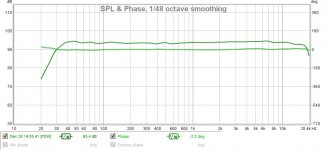
I've generated the CSD in accordance to your settings. What does it show. Is the hand over clean?

This one is with the same setting except the time range has been shortened to 4ms. Hope it helps.
The cursor is at 2.66kHz. This is where the acoustic slopes of the woofer and tweeter cross.

The cursor is at 2.66kHz. This is where the acoustic slopes of the woofer and tweeter cross.
I've measured similar phase responses with rew, arta and smaart.Yes, you brought up a good point. Unfortunately as DIYers, that's all we can afford. REW is not the same as professional grade measurement equipment but I don't think it's so bad that the measurements are false.
However, I'll be happy to re-run my measurements if you can provide me with the professional grade hardware and software. 🙂
All these are good tools where they made for
You need only to time align at what frequency is your cross over frequency, if there are other time different in other frequencys doesnt matter...
Hi Presidentovich
Thank you for your input. Yes, that is what I've been trying to show. I mentioned crossover frequency, phase alignment at crossover frequency, null at crossover frequency and how they are all related to time-alignment between woofer and tweeter. My explanation must be very bad. 🙁
can also see with oscilloscope if you have and a cheap microphone.
I'm sorry, I don't understand. Can you explain how I can do this.
I just wish that you avoid provocative lecturing until information is more reliable - not flaming with opinions.
Hi kimmosto
I'm sorry if I have offended you. It was not my intention. Is that what is known as "flaming". This new terms are beyond me.
You don't need pro gear for measuring accurate timing and timing difference. Just trash equipment which prevents dual channel measurement, and purchase common 2ch sound card with phantom power, loop cable and traditional measurement mic. REW is okay after that also for timing measurements, though it's still worse for speaker engineering than e.g. ARTA (which is not pro software either). Without dual channel gear there is no guarantee that measured timing difference is correct and repeatable, though all settings are kept unchanged. I've tested this quite recently with REW and Umik-1.
I read about that in REW. Apparently their latest version doesn't require the loop thing for accuracy.
.... but my work of few thousand hours to produce freeware speaker simulator must be enough.
I am interested to know more about your freeware. Where can I download it.
I've measured similar phase responses with rew, arta and smaart.
All these are good tools where they made for
Hi manninen
Thank you for sharing this. It's only recently that I used REW, and that is for time alignment. I have a vague idea of arta but not smaart. I will look into them. For basic measurements, I use Omnimic most of the time. I seldom use my LMS nowadays.
Not exactly one of the 1% either ......
Used HolmImpulse to establish the arrival time difference.
RePhase for the phase linearisation.
And as you see, REW for the attached measurements. All free.
Thanks for the tip. I like to hear the word FREE.🙂
I have no experience with HolmImpulse. I always thought that it is for designing horns and transmission line speakers.
As for RePhase, I will certainly look into it. I assume this is a free software that runs off my pc (windows xp). I am still using an out-dated M-audio Delta 66 soundcard for all my measurements.
I have no experience with HolmImpulse. I always thought that it is for designing horns and transmission line speakers.
That would be the "Hornresp"
Hi kimmosto
I'm sorry if I have offended you. It was not my intention. Is that what is known as "flaming". This new terms are beyond me.
I think this one flew over your head. I don't think he was offended. What he tries to say is that you should be careful not to lecture people when your own knowledge might not be sufficient - which you actually showed in this thread a couple of times.
//
I'm not so sure, I think it is a ploy to get people to respond.....it often workswhen your own knowledge might not be sufficient - which you actually showed in this thread a couple of times.
//
I think this one flew over your head. I don't think he was offended. What he tries to say is that you should be careful not to lecture people when your own knowledge might not be sufficient
Did I come across as lecturing 🙁
You guys should lighten up. Don't take yourself so seriously. 🙂
...which you actually showed in this thread a couple of times
There's a term called "clowning around." 😀
As for my knowledge, I did not claim I'm an expert in this field. You can take me for an idiot for all I care. It makes absolutely no difference to me.
However, what makes a difference is someone who can post their own designs of passive time aligned speakers so that I can share my findings with. So far, nobody has posted anything yet.
I'll be happy to review your passive time-aligned speakers if you have one.
I'm not so sure, I think it is a ploy to get people to respond.....it often works
scott.........you're my MAN.... 🙂
Thank you for highlighting that.
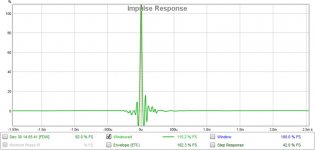
The negative spike is from REW. I think it's called a pre-spike or something. The actual measurement starts from 0 at X-Y axis.
Nope, the negative spike is indicating that the drivers are not time aligned as mentioned in post 82. I also use REW and in the same post there is no "pre-spike" on the time aligned step response I provided. The spike is from your measurement, not an artefact from REW...
Since you have already made the measurement, why not show us the step response using the same horizontal scale as in post 82 - i.e. over 20 ms and post a larger image. This will definitively show time alignment or not...
Hope these help.


Hi Mark
<snip>
Hi Michael, my turn to apologize. I came home from a neighborhood party with better than a bottle of wine in me, and didn't even look at the graph's axis 😱
Yep, fairly familiar with REW, although I use smaart mainly....which btw I agree with manninen that both work just fine.
Anyway, I've been working on a new 12" mid range box, and made first measurements yesterday.
For the heck of it, and to demonstrate the power and efficacy of DSP, I set a sub and a HF/VHF box on the floor next to the new mid box in a small arc, pointing at a mic laying on the floor.
So it's a "don't kick anything or you'll lose alignment" 4-way 😀
consisting of an 18" sub, the 12" mid, and a coaxial compression driver.
Here's a quick and nasty DSP/FIR tuning with linear phase x-overs at 120Hz, 650Hz, and 6300Hz. FDW 6 windowing.
DSP/FIR makes things so easy IMO !
Attachments

Lets all be gentle here, we're all here to learn (at least I know I am).
That's why I asked for that waterfall plot. Something is happening here, the downward peak in the STEP is caused by 'something'. It could be energy high up, all I know it does need more research to find the why.
Michael, the early waterfall graph doesn't look bad at all at the frequency where one driver crosses over to the next. That was the point of this exercise. I usually use that setting to get a clear look at that first wave front that would hit my ears. It looks pretty clean. Zoom in to represent the average on top and use about 30 dB down from that average for a closer look. The time frame you'd need is about right, I like that second plot a little more, as it shows us a noise floor.
It is quite clean, how far from the actual speaker was this measurement taken? The reason to ask this question is simple, things change when we move further out. For example, if that measurement was taken at ~0.5 m, timing between tweeter and woofer would look way different at ~2.5 m.
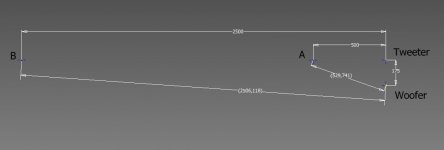
See this simple sketch here:
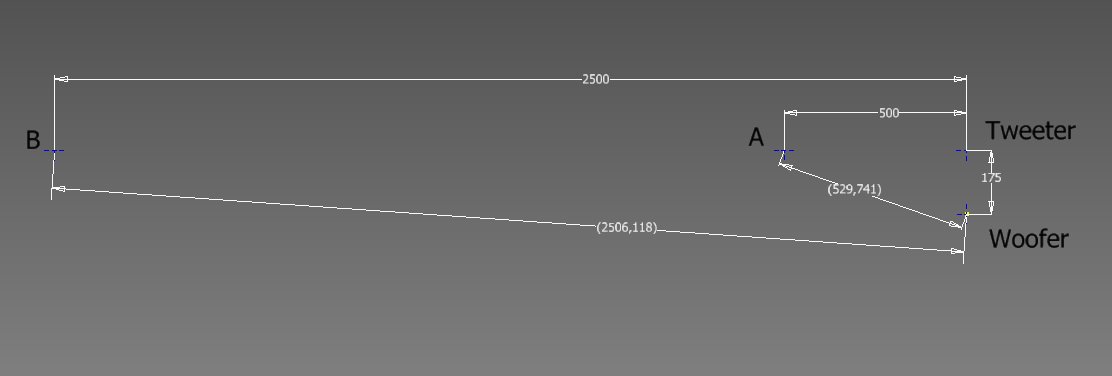
Quite the difference between our ear and each driver at 0.5 m and the one at 2.5 m. Just a hypothetical example meant to think about. A sample, nothing more.
The relation between tweeter and woofer will change when moving further away. What we see in this hypothetical example is that if we time-align a speaker at close range, it might not hold up at distances further away.
The difference between our ear to woofer and our ear to tweeter is significant between these two positions. I'm not saying this is the case for you, just a general example showing why I deem it important to look what happens at actual listening distances. Not just at close range to get clear reflection free measurements. A difference of 23 mm in my above example is quite something for higher frequencies. Just another thing to be aware about.
Every reflection and room disturbance will show up in the IR as well as the STEP response.
The IR plot, zoomed out to 20 ms you showed is a good example of this.
That plot shows a new upwards trend just after 3 ms. A tell tale sign of a reflection. These reflections will also change phase behaviour of our frequency curve.
(A reason for me to often use frequency dependent windows)
Moving trough the other tabs in REW we could find a lot more info about those reflections. That's where I found out where to place damping panels and even how thick I needed to make them to be of use.
Just for reference I will post my IR/STEP, as taken at the listening spot:

This is the IR of both channels firing together at once, a Stereo result in the sweet spot.
While this clearly shows some restlessness in the IR at that spot (the low "grass" showing up at the bottom is indeed caused by reflections etc), you see no sudden or big changes in the flow and shape of the STEP. The overall shape of that STEP is determined by it's frequency response (declining from low frequency to high and band passed). The two cannot be separated. It's just another way of showing the same data. All of these graphs do tell us something. What I've been trying to do is relate them to my listening experience as best as I can.

This is with a frequency dependent window of ~6 cycles.
While I do use FIR filtering and EQ, this IR I show could not have been as clean or realized without good old fashioned damping panels at first reflection points. This brought down the reflections just far enough, not to influence the general shape of the STEP.
When viewed in a Wavelet (using one the new features in REW) it shows arrival times at the ear:

I've listened to a linear phase correction and what you see here, phase following the band pass behaviour of the frequency response. That last one is my subjective favourite. Phase largely following the band pass behaviour of my frequency response.
Again, this is taken at the listening spot. Basically the most important spot in the room 😉 (for me anyways). Here we do see some of the power of FIR filtering. Though I need to hammer this down, this would not have been possible without old fashioned absorbing panels! Arrays are strange animals, They react different to reflective surfaces, which makes it easier to absorb that reflective energy. The biggest culprits are the surfaces parallel to the arrays, as seen from the listening position.
Disclaimer, I did have one to many beers before typing this. I do not mean to lecture here, just provide some things to think about. I still believe if we all work together we can actually advance this hobby of ours. I know I've learned most of what I know just by paying attention when people like Geddes type their responses. First thing to do is get close with the programs we use to analyse our data, in my case REW. Learn what each TAB can tell you. We really need them all. 🙂
That's why I asked for that waterfall plot. Something is happening here, the downward peak in the STEP is caused by 'something'. It could be energy high up, all I know it does need more research to find the why.
Michael, the early waterfall graph doesn't look bad at all at the frequency where one driver crosses over to the next. That was the point of this exercise. I usually use that setting to get a clear look at that first wave front that would hit my ears. It looks pretty clean. Zoom in to represent the average on top and use about 30 dB down from that average for a closer look. The time frame you'd need is about right, I like that second plot a little more, as it shows us a noise floor.
It is quite clean, how far from the actual speaker was this measurement taken? The reason to ask this question is simple, things change when we move further out. For example, if that measurement was taken at ~0.5 m, timing between tweeter and woofer would look way different at ~2.5 m.
See this simple sketch here:
Quite the difference between our ear and each driver at 0.5 m and the one at 2.5 m. Just a hypothetical example meant to think about. A sample, nothing more.
The relation between tweeter and woofer will change when moving further away. What we see in this hypothetical example is that if we time-align a speaker at close range, it might not hold up at distances further away.
The difference between our ear to woofer and our ear to tweeter is significant between these two positions. I'm not saying this is the case for you, just a general example showing why I deem it important to look what happens at actual listening distances. Not just at close range to get clear reflection free measurements. A difference of 23 mm in my above example is quite something for higher frequencies. Just another thing to be aware about.
Every reflection and room disturbance will show up in the IR as well as the STEP response.
The IR plot, zoomed out to 20 ms you showed is a good example of this.
That plot shows a new upwards trend just after 3 ms. A tell tale sign of a reflection. These reflections will also change phase behaviour of our frequency curve.
(A reason for me to often use frequency dependent windows)
Moving trough the other tabs in REW we could find a lot more info about those reflections. That's where I found out where to place damping panels and even how thick I needed to make them to be of use.
Just for reference I will post my IR/STEP, as taken at the listening spot:
This is the IR of both channels firing together at once, a Stereo result in the sweet spot.
While this clearly shows some restlessness in the IR at that spot (the low "grass" showing up at the bottom is indeed caused by reflections etc), you see no sudden or big changes in the flow and shape of the STEP. The overall shape of that STEP is determined by it's frequency response (declining from low frequency to high and band passed). The two cannot be separated. It's just another way of showing the same data. All of these graphs do tell us something. What I've been trying to do is relate them to my listening experience as best as I can.
This is with a frequency dependent window of ~6 cycles.
While I do use FIR filtering and EQ, this IR I show could not have been as clean or realized without good old fashioned damping panels at first reflection points. This brought down the reflections just far enough, not to influence the general shape of the STEP.
When viewed in a Wavelet (using one the new features in REW) it shows arrival times at the ear:
I've listened to a linear phase correction and what you see here, phase following the band pass behaviour of the frequency response. That last one is my subjective favourite. Phase largely following the band pass behaviour of my frequency response.
Again, this is taken at the listening spot. Basically the most important spot in the room 😉 (for me anyways). Here we do see some of the power of FIR filtering. Though I need to hammer this down, this would not have been possible without old fashioned absorbing panels! Arrays are strange animals, They react different to reflective surfaces, which makes it easier to absorb that reflective energy. The biggest culprits are the surfaces parallel to the arrays, as seen from the listening position.
Disclaimer, I did have one to many beers before typing this. I do not mean to lecture here, just provide some things to think about. I still believe if we all work together we can actually advance this hobby of ours. I know I've learned most of what I know just by paying attention when people like Geddes type their responses. First thing to do is get close with the programs we use to analyse our data, in my case REW. Learn what each TAB can tell you. We really need them all. 🙂
Attachments
Last edited:
Hope these help.
Interesting... Btw, I am with wesayso, always learning something new about this wonderful hobby...
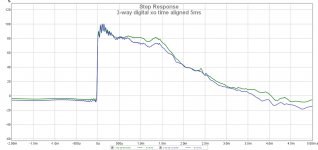
How about one more zoom of the step, e.g. like the first 5ms in the example below. This is at the listening position 10ft away:
Attachments
- Status
- Not open for further replies.
- Home
- Loudspeakers
- Multi-Way
- What is Time-Alignment