...the capability of the spectrographs.
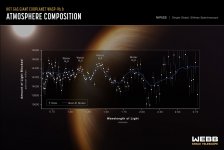
As shown by the transmission spectrum of the atmosphere of exoplanet WASP-96 b which has revealed the presence of water.
The instrument used is the Near-Infrared Imager and Slitless Spectrograph (NIRISS).
"NIRISS is able to detect colour differences of only about one thousandth of a micron (the difference between green and yellow is about 50 microns), and differences in the brightness between those colours of a few hundred parts per million."
https://exoplanets.nasa.gov/news/1707/webb-reveals-steamy-atmosphere-of-distant-planet-in-detail/
P.S. The hot gas giant exoplanet is 1,150 light years away!
Attachments
I would still say Hubble's are a bit better.
Here's the bottom line on the "sharpness" issue, specially for you, Pete.
As Webb has a diameter 3x that of Hubble, it would have a 3x better resolution if observing at the same wavelength as Hubble.
However, Webb will be observing at a wide range of wavelengths, starting at the high-end of Hubble to 30 times as long as Hubble.
Because of this, the resolution of the images provided by Webb will be slightly better/on-par at its shorter wavelengths, and about an order of magnitude worse at its longest wavelengths, than that of Hubble.

With the added advantage of not having to spend a month in photoshop after each observation to prettify it for the masses. Just biiiig error bands on the plot.Far more is the capability of the spectrographs.
On spectroscopy I did once have the joy once of being bamboozled by Roger Griffin on his work on Radial-Velocity Spectrometry and how he machined his own lens for the prototype from a block of perspex. Helped me realise at an early age I was neither clever enough or stoic enough to make it in astronomy.
Human emotions doesn't effect the result. They are worthless in the ways of Science. Cringe or not. Atleast they aren't saying earth is flat. That's why it's our home.😎
Not sure what you mean by "any of the work". NASA's own images are what I'm referring to. Does it get any better than that? Maybe it's just my laptop, MacBook Pro 13"? Or I'm just expecting too much? Even that first image is "good" imo, not great. Please keep in mind I'm not referring to the content or resolution, only focus/sharpness although it may be related to resolution? Hubble has much sharper images imo.
Most of the images from Hubble are software processed to oblivion. If you saw the raw data it's basically a mono bitty mess. Additionally they developed super resolution processing specifically for Hubble.
Each of the sensors is specifically designed for their purpose rather than operating to make images. Hence they have different sensor pixel sizes and thus some have better resolution than others.
The point spread function is actually better than Hubble. What could also be playing a part is the sensitivity to noise with different well depths for the sensors and thus different noise/ADC working ranges.
I've got a number of Peltier cooled CCD (ie -24degC) camera with different sensor pixel sizes and you get some trade offs due to the number of electrons that can be held before saturation. The smaller the pixel the less well depth. Mixing sensor size images can lead to ghosting where the large pixels cover more area but then the more smaller pixel detail can show up in areas but then quickly saturate.
The image stacking then aligns the images according to the objects centres rather than pixels so the final image gets blurred and detail at the same time.
I wrote both in camera software including programming the ADC etc, plus post processing using GPU image processing and stacking in realtime for bright targets and camera exposure time for dim ones.
Is that guy really a "scientist with the European Space Agency?"
That guy at the left on the video was just a poorly informed studio presenter. The representative from the ESA was blameless.
The point spread function is actually better than Hubble.
The fact that Webb's mirror is split into segments produces a "snowflake" pattern when observing a point of light such as an individual star.
This pattern is much more complicated than the "cross shaped" pattern produced by Hubble.
Entangled snowflake patterns become troublesome when viewing extended stuctures like galaxies and must be compensated for.
EDIT: You need to explain "point spread function" to me as I clearly have misunderstood its meaning.
Last edited:
Ouch! Point Spread Function (PSF) is rather complicated, but in simple terms can be thought of as the extended blob in an image that represents a single point object. https://en.wikipedia.org/wiki/Point_spread_function
What could also be playing a part is the sensitivity to noise with different well depths for the sensors...
Easy Nick, you are primarily talking to armchair astronomers here. 🤓
I read that "well depth" is related to the amount of charge an individual pixel can hold before saturating.
Saturation is to be avoided because it produces image smearing due to blooming.
https://www.photometrics.com/learn/imaging-topics/saturation-and-blooming
The fact that Webb's mirror is split into segments produces a "snowflake" pattern when observing a point of light such as an individual star.
This pattern is much more complicated than the "cross shaped" pattern produced by Hubble.
Entangled snowflake patterns become troublesome when viewing extended stuctures like galaxies and must be compensated for.
EDIT: You need to explain "point spread function" to me as I clearly have misunderstood its meaning.
In short - it's the mathematical function that maps between the perfect star/image and what you have in front of you. It's not just one PSF but a number all combined together. The telescope, the atmosphere and the everything from the source (including an Einstein lens) each have a PSF. Then combine them to get your final PSF.
Years ago I wrote a nice forum article titled "What did the Point Spread Function (PSF) ever do for us?"
PART1
Unfortunately quite a bit. It's part of the reason my image doesn't look like hubble for a start..
Here you can see the additional PSF between bubble's image and a basic stacked image of mine. It's the reason why everything is a little bit more blurred. However even Hubble has a PSF! We can look at an ideal mathematically generated PSF and show the PSF between Hubble and my image - lets just look at the bright star in the top left of the hubble image:
Strictly speaking the ideal image is also a PSF caused by the circular aperture.. as we're all looking through circular things.. then lets just ignore that point 😀
Lets look at each star with a plot of the image. If you imagine the difference between the plots in 3D - that's the point spread function.
First the ideal PSF:
You'll note that I've shown a 2D slice through to make it easier to see. The centre bright spot is in the middle, the brightness of the star then quickly drops creating a nice around appearance. But wait - what's the little rings around it? Well these are caused by looking through a circular aperture - known as defraction - and they appear as the little bumps at the bottom of the graph.
Next Hubble's:
The top is is flat showing that the centre of the star was too bright. however the sides quickly drop evenly away and it looks very close to the ideal plot above. You'll note the spikes caused by Hubble's secondary mirror supports - a natural additional "defraction spikes" that reflector owners put up with.
Then finally mine:
The first thing you'll note is the gentle slopes of the image that aren't circular. I'm using a refractor so the image doesn't have defraction spikes. The scope is operating at below dawes limit - this means that a point smaller than the limit means it gets blurred due to defraction .. this all adds to my PSF complexity. Guiding errors also add to the non-roundness of the stars and this is what you're seeing here. Additionally the earth's atmosphere that bubbles moves the point around causing additional blurring.
Wait? Why aren't they the same? Well the PSF is a cunning beast - it changes completely between images and even over the time you take an image. Next time you look up and see the stars twinkle then you're seeing the PSF change over time and so the star appears to change over time thus the twinkle.
The last point is that PSF doesn't just affect the stars.. it affects the whole image resulting in a blurred mess - including nebulosity, galaxies - that means you'll miss some lovely little things in the background hidden in the blur..
The technical term of all this badness is "Convolution".
Doooomed! We're all Doooomed!
Well not really - what if you could undo all this "Convolution" .. well "Deconvolution" is the technical term for reversing all the blurring.
Wait? You're going to list lots of maths now.. well actually you don't need to. cheer here but we can do away with grandiose terms such as vector spaces etc as you can use your imagination instead. Just think if it as taking sand and moving the sand to correct the shape.
The stars in the image provide a great point of reference we can use for analysis.
PART2
Undoing the blur
Imagine taking my 3D plot and pulling in the sides of the slope proportionally to match the ideal PSF - the top peak of the plot will pile up taller so the star will appear brighter and more rounded.
But we don't do this for just the stars. We do the same shifting for each pixel in the image depending on the different against the PSFs. The result of doing this is that the we uncover new detail in the target, clean up nebulosity and see new detail in the background (such as small galaxies).
Here you can see the processing taking effect:
Before:


During:


You can see the peak hitting the top (saturation).
End:


Undoing the blur
Imagine taking my 3D plot and pulling in the sides of the slope proportionally to match the ideal PSF - the top peak of the plot will pile up taller so the star will appear brighter and more rounded.
But we don't do this for just the stars. We do the same shifting for each pixel in the image depending on the different against the PSFs. The result of doing this is that the we uncover new detail in the target, clean up nebulosity and see new detail in the background (such as small galaxies).
Here you can see the processing taking effect:
Before:
During:
You can see the peak hitting the top (saturation).
End:
Easy Nick, you are primarily talking to armchair astronomers here. 🤓
I read that "well depth" is related to the amount of charge an individual pixel can hold before saturating.
Saturation is to be avoided because it produces image smearing due to blooming.
https://www.photometrics.com/learn/imaging-topics/saturation-and-blooming
Yes
The behaviour of blooming depends on the sensor construction. If the sensor is read in row, often it bleeds along the row in both directions creating part or completely white (saturated) lines across the sensor. Naturally you have no data at that point. If the sensor doesn't have good bloom control that can spill in vertically too. Bloom control means sensor real estate sacrificed for grounding wires so you get missing areas of images but nobody is bother unless your doing science or inspection work.
Also the ADC preamps can be configured to bias the image to facilitate the removal of noise which can reduce the actual well depth. You also get noise thermally, defective pixels and from the read process (ie the pixels are shifted across the sensor when read, the electronics and conversion) causing gradients etc.
There's differences between the old CCD and the CMOS style readouts that cause more noise on the CMOS. However virtually all the old CCD sensors have been discontinued in favour of the cheaper CMOS but they have come along way to bridge the gap.
One important point here is that all the sensors used tend to be mono - mine are too as you don't have the colour matix messing up the image like you do with a colour camera. The down side is you need an image with each filter in front of the camera making it a longer process to take a complete colour image. So my images are 16 bit mono for any image I take - be it mono (luminance) or with each RGB.. so my colour images are actually 4x16bits! Far higher colour resolution than any RGB screen (which has 12bit for the all four RGB+Alpha channels).
Last edited:
Any details on your DIY spectroscope?I've done alot of astronomic imaging but specifically high resolution information recovery using a 4" refractor in the back garden:
View attachment 1072005
Those four dots are the sensor pixel sizes. Which means that's 28 arc seconds across.
The bear paw:
View attachment 1072004
Compared to my 4" image above, this is what a space telescope sees: https://en.wikipedia.org/wiki/NGC_2537
And to show post processing - before:
View attachment 1072003
After:
View attachment 1072002
Enough to say - JWT is exceptional but for the most part just the visible wavelength is actually the less impressive stuff. Far more is the capability of the spectrographs. I built a DIY spectroscope for sun hydrogen alpha and got a resolution R6000 and bandwidth of 0.9Angstroms according to one of the professionals analysing my sodium test image. That's enough to be able show the movement red shift in hydrogen gas as it moves on the sun.
JWST's is far better: https://www.cosmos.esa.int/web/jwst-nirspec/nirspec-performances
Any details on your DIY spectroscope?
It was (now disassembled) made up of a 910mm FL scope with two telephoto lenses (cannon 300mm f4) with a Thorlabs slot and defraction grating. The idea was for sun imaging.
First the component layout:

I used a high pressure sodium bulb initially to get the alignment and first spectra:
And a test shot at a CFL light to get sodium lines, cropped to show the native resolution :
So those two lines above are the two yellow lines just at the start of the yellow.
And first light at the sun:
The next step was to make a scanning spectrograph using a CD mechanism but unfortunately life got in the way and so I couldn't spend the time staying up all night or all day.
Sorry for dragging the thread off topic 🙂
Last edited:
Sorry for dragging the thread off topic 🙂
Well, I did ask! 😀
Truth be told, you had me at "Deconvolution". 👍
Deconvolution: the improvement of resolution of images or other data by a mathematical algorithm designed to separate the information from artefacts which result from the method of collecting it.
Descintillating mirrors on telescopes is another thing that really really shouldn't work and does my head in that it does.Well the PSF is a cunning beast - it changes completely between images and even over the time you take an image. Next time you look up and see the stars twinkle then you're seeing the PSF change over time and so the star appears to change over time thus the twinkle.
I remember after Hubble (or as Nick's autocorrect says 'bubble' 🙂 ) was launched with the exact error in its mirror there was a lot of excitement over developing the mathematical techniques to correct the images. IIRC they were using some maximum entropy techniques to get as much as they could from what they had?Truth be told, you had me at "Deconvolution". 👍
IIRC they were using some maximum entropy techniques...
Please do not mention "entropy" when Bonsai is about! 😀
- Status
- Not open for further replies.
- Home
- Member Areas
- The Lounge
- What is the Universe expanding into..