I can do that. But just FYI, what I have presented recently was all direct "ac analysis", with no time-domain simulation involved.
Wait. What is "IA"?
Not sure what I was thinking, when I wrote that. The THD analyses were performed with time-domain runs in LT-Spice.
Anyway, doing more of them, today, with instrumentation amps connected, I can get the THD trend to go in the opposite direction, i.e. the single cable model does better than the bi-wired model, and even better as cable length is increased. FFT confirms. And apparently it's mostly third harmonic, probably from the IAs. Will try a better IA circuit, and see if it changes.
Spice has a "perfect IA" - the "E" VCVS
you can also clean up comparison in AC analysis by dividing waveforms by each other, or a reference waveform - works fine with the complex values, stepped parameter analysis
just use waveform arithmetic – enter equation of values in the waveform viewer “add trace” dialog box
I can't tell if people are going off the rails again – there is no intermod in linear systems, superposition works, works for linear R, L, C, even skin/proximity magnetic fields
you need to introduce nonlinear component models into the situation for distortion/intermod products
some are very second order
typical cable R is Cu, with a large 0.4%/C tempco - with a severe low pass from thermal mass/heat capacity
insulation isn't perfectly rigid so magnetic and "electrostatic" forces exist which in principle physically move the pair of wires together, modulating cable L, C
Last edited:
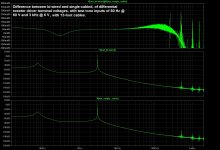
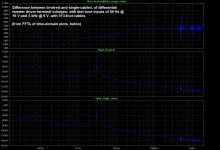
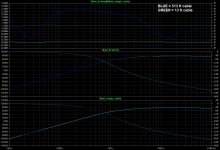
Thanks, jcx. I used the e-sources as perfect differential instrumentation amplifiers and got the attached.
I ran time-domain ("Transient") simulations for cables of 13 feet and 513 feet, and then did FFTs, which are attached.
So there appears to be a difference between bi-wired and single-cabled, which also becomes more apparent as the cable length increases, as would be expected.
I ran time-domain ("Transient") simulations for cables of 13 feet and 513 feet, and then did FFTs, which are attached.
So there appears to be a difference between bi-wired and single-cabled, which also becomes more apparent as the cable length increases, as would be expected.
Attachments
Last edited:
I'm not sure whether skin effect is relevant here. I don't know whether skin effect gets worse when conductors are paralleled (proximity effect) or whether it gets better. I think skin/proximity effect maybe significant in the treble, but I couldn't figure out how to calculate it. Note: I define significant as whether or not the skin effect is greater than the inductance and resistance at any point along the impedance curve of the cable.
The "skin effect" so beloved of cable snake oil salesmen, is directly related to the frequency of the signal on the cable. It only starts to become important at frequencies WAAAAYYYYYY beyond audio frequencies in the megahertz.
The only real reason why stranded cable is prefered in most audio applications is that it is more flexible and breaks less easily.
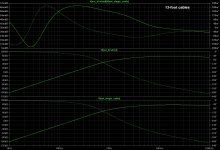
Thanks, jcx. I used the e-sources as perfect differential instrumentation amplifiers and got the attached.
I ran time-domain ("Transient") simulations for cables of 13 feet and 513 feet, and then did FFTs, which are attached.
So there appears to be a difference between bi-wired and single-cabled, which also becomes more apparent as the cable length increases, as would be expected.
Erratum: In the second plot that I posted, the 80 Hz amplitude was 60 V, not 16 V.
Also, the series resistances in the cable models look shorted, in the schematic. But they had been included in the inductors, as the ESRs.
Thanks, jcx. I used the e-sources as perfect differential instrumentation amplifiers and got the attached.
I ran time-domain ("Transient") simulations for cables of 13 feet and 513 feet, and then did FFTs, which are attached.
So there appears to be a difference between bi-wired and single-cabled, which also becomes more apparent as the cable length increases, as would be expected.
Your plots are showing transmission line effects. The mono case has a significantly different termination impedance, so your seeing reflection stuff. My expectation is if you double the length, the spikes will drop in frequency.
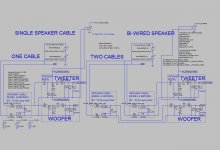
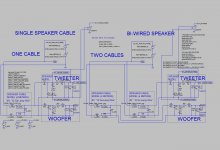
Is the biwire "difference" voltage levels subtracted after level measurement, or did you use an ideal analog subtractor and then measure the difference? Your schematic appears to be measure first, then subtract.
Ah, endgame preview. Do you have the ability to provide scope photo's of the analog diff?
And how is the transient capability of the package?
Nice work however, I thank you for taking the time and the effort.
John
Please consider the amplifier in your thoughts about bi-wiring
Dear all,
Sorry I skipped reading all this thread, (too much hot air in the middle of it) but my 2 cents hypothesis for my observed beliefs (And I thought it was snake oil until I listened and heard a difference):
My hypothesis to explain the effect is that by sending the drivers harmonic distortion (causing back EMF) through two series resistors (the speaker wires) and one parallel resistor (the amp) you get greater attenuation of driver harmonic distortion effecting the higher frequency driver. This would explain Bi-amping being better than bi-wiring and bi wiring being better than a single cable. The advantages of Bi-wiring would be dominated by the ratio of speaker connection and cable resistance to amplifier output resistance.
I suggest an experiment to measure this effect.
First test if you can see a difference in the signal sent to drivers with normal passive cross over and with Bi-amping. Since most people say bi-amping is better than bi-wiring and conventional amping. If no differences are observed, put 0.5 Ohm or greater resistors in series with the speakers cables and remeasure.
* If no difference can be measured it does not prove biamping does not improve things only that you cant measure it and no further experiments should be completed.
* If a difference can be measured
A two way speaker, driven by a solid state amplifier (with as low output impedance as possible so definitely not a valve/tube amp) with 0.5 Ohm resistor in series with the speaker cable. Measure the signal reaching the tweeter then bi-wire with a 0.5 Ohm resistor in series with each bi-wired speaker cable, and remeasure the signal reaching the tweeter.
* Again if no difference can be measured it proves nothing.
* If you measure a difference then bi-wiring has an effect even with the 0.5 Ohm resistor in series.
If a measured difference is observable, but is reduced or disappears if you remove the resistors / use a higher output impedance amplifier, it would contribute to the evidence for the hypothesis. (it is my subjective listening opinion 20 years ago that this occurs)
Sadly no measurements have been made by me in this area by me.
Best of luck
Owen
What does the crossover do differently when you bi-wire?
I know what mine will do differently
building a PA top with doubled outputs for two setups
one 2way, and one 3way 😀
I know what mine will do differently
building a PA top with doubled outputs for two setups
one 2way, and one 3way 😀
Well that is turning out to be an odd one...Some change I made must have caused something pathological in my schematic.
Any luck tracking down the odd issue with your Triple EF output circuit?
Thanks again for posting the LTspice files for others to play with.
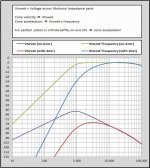
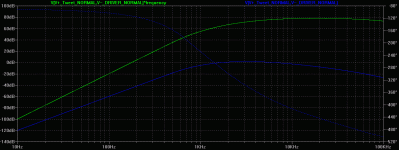
I started working with your Simple-Source file last night. I'd like to better understand the tweeter response differences when bi-wiring vs single wiring. Most result directly from the woofer current producing a voltage drop/increment in the single wire, but the differences at higher frequencies appear to include other effects as well. I also still need to wrap my head around the distortion effects you have been posting...
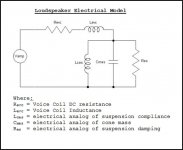
I noticed you started using the voltage applied to the drivers for comparisons as SY had suggested back in post#217. This reminded me that I was going to look up what the voltage across the motional impedance parts represented. This voltage(Vtweet in your LTspice models) is analogous to the voice coil or cone velocity. Multiplying this voltage by frequency to get cone acceleration and you would have an output signal proportional to the far field on-axis response of a perfectly ridged piston. As an example, I plotted the velocity and on-axis response for your tweeter with and without the crossover components.
Response is normalized to 0dB as shown for input voltage = 2*pi*Cmes*Revc
If more than one driver is used and you want to plot relative response levels between the drivers, you would need to include the effects of motor strength(BL) and cone area(Sd).
Attachments
btw, or another very simple way of looking at it
and far from this impressive scientific detective work
either it makes no difference, and as such pointless
or if it really made a difference then speaker function have been changed
not so wise, considering it was designed to work properly 'as is'


and far from this impressive scientific detective work
either it makes no difference, and as such pointless
or if it really made a difference then speaker function have been changed
not so wise, considering it was designed to work properly 'as is'
Any luck tracking down the odd issue with your Triple EF output circuit?
Thanks again for posting the LTspice files for others to play with.
I started working with your Simple-Source file last night. I'd like to better understand the tweeter response differences when bi-wiring vs single wiring. Most result directly from the woofer current producing a voltage drop/increment in the single wire, but the differences at higher frequencies appear to include other effects as well. I also still need to wrap my head around the distortion effects you have been posting...
I noticed you started using the voltage applied to the drivers for comparisons as SY had suggested back in post#217. This reminded me that I was going to look up what the voltage across the motional impedance parts represented. This voltage(Vtweet in your LTspice models) is analogous to the voice coil or cone velocity. Multiplying this voltage by frequency to get cone acceleration and you would have an output signal proportional to the far field on-axis response of a perfectly ridged piston. As an example, I plotted the velocity and on-axis response for your tweeter with and without the crossover components.
Response is normalized to 0dB as shown for input voltage = 2*pi*Cmes*Revc
If more than one driver is used and you want to plot relative response levels between the drivers, you would need to include the effects of motor strength(BL) and cone area(Sd).
I haven't had any time to go back and try to track down the problem with that simulation.
For the attached. I am not at all sure that I have correctly multiplied by frequency. I have not used Laplace voltage-controlled voltage sources very much, and never routinely.
Attached are some plots, and the schematic and LT-Spice .asc file that produced them. (Remove the .txt from the .asc file name, before running it with LT-Spice.)
Cheers,
Tom
Attachments
Tom,
the distortion results from the file in post 312 look like simulator residual to me. Changing some options like ".opt numdgt=15" and decreasing tolerance settings yields all 4Z values (0.000x). That what is left is either the noise floor limit (when it doesn't change with sim time length) or L's and C's still settling from the very non-sinusoidal beginning of the test signal, then you simply have to wait longer until it dives down into the noise.
the distortion results from the file in post 312 look like simulator residual to me. Changing some options like ".opt numdgt=15" and decreasing tolerance settings yields all 4Z values (0.000x). That what is left is either the noise floor limit (when it doesn't change with sim time length) or L's and C's still settling from the very non-sinusoidal beginning of the test signal, then you simply have to wait longer until it dives down into the noise.
Tom,
the distortion results from the file in post 312 look like simulator residual to me. Changing some options like ".opt numdgt=15" and decreasing tolerance settings yields all 4Z values (0.000x). That what is left is either the noise floor limit (when it doesn't change with sim time length) or L's and C's still settling from the very non-sinusoidal beginning of the test signal, then you simply have to wait longer until it dives down into the noise.
aha.... like music.
The test design I mentioned awhile back allows for the use of a non steady state signal to notice the mono to biwire difference...just drive the amp with an ipod...and scope the diff.
jn
Er, I was just pointing out that THD/HD simulations of linear circuits -- besides questioning the usefulness of this in general 😉 -- in ppm territory are often plagued (dominated) by time constants that can be misleading (when you sim with real amplifier circuits rather than ideal sources). When you start a sine abruptly (rectangular window) we have a wide-band signal that needs to settle when passing through RLC networks. If you FFT a single period too early in time there will still be some settling tail polluting the result.
Last edited:
Absolutely. You point out a good issue with simulation. I had this issue in 2005 when I also did the bi to mono sims that are being repeated here.Er, I was just pointing out that simulations in ppm territory are often plagued (dominated) by time constants that can be misleading. When you start a sine abruptly (rectangular window) we have a wide-band signal that needs to settle when passing through RLC networks.
That's why the hardware test is so important.
Pano man, where are you?
jn
Yes, you are both right. I was pretty familiar with those kinds of THD artifacts and effects, back when I did a lot of simulating, and eventually realized it, in this case, and then almost mentioned it, except I have been extremely short of time for at least the last week.
So, jneutron, is my setup what you envisioned, so that it might be useful to pump some music through my simulation, or maybe something like square waves? I guess I would just need to add one more ideal difference amplifier, to see the difference between the outputs of the first two difference amplifiers? (Actually, I guess I was already doing that, with waveform arithmetic.)
So, jneutron, is my setup what you envisioned, so that it might be useful to pump some music through my simulation, or maybe something like square waves? I guess I would just need to add one more ideal difference amplifier, to see the difference between the outputs of the first two difference amplifiers? (Actually, I guess I was already doing that, with waveform arithmetic.)
Last edited:
For the attached. I am not at all sure that I have correctly multiplied by frequency. I have not used Laplace voltage-controlled voltage sources very much, and never routinely.
Huh...I'd never considered handling it that way, but looks to give the correct result.
I usually just use the expression editor to multiply by frequency as shown in attached plot.
Attachments
- Status
- Not open for further replies.
- Home
- Loudspeakers
- Multi-Way
- What does the crossover do differently when you bi-wire?