
You can do that with any sort of wiring.
..and it's entirely possible that the sort of subjective preference some seem to have with bi-wiring will present itself under this condition with "single" wiring.
..and it's entirely possible that the sort of subjective preference some seem to have with bi-wiring will present itself under this condition with "single" wiring.
I actually didn't follow your sentence. Could you possibly elaborate a tad?
Pano:
I've tried to no avail to search AH for my posts, diagrams, analysis', test setups for the biwiring stuff I posted there. The time was 2005 early.
During that discussion, my inputs were inconsistent with the site owner's desires, and somewhere during the back and forth, my user allowed space for putting up jpegs suddenly became restricted to a level 10% of what I already had there. So I was essentially zero'd out of any ability to support the discussion. It was never explained to me why that happened. I was also tossed some infractions as a result... Me....infractions?? I'm such a laid back pleasant fellow....😕 (yah, I probably deserved them).😉
I've retrieved the hard drives from my old computer so I can pull my content. I just have to find an SATA mobile adapter.
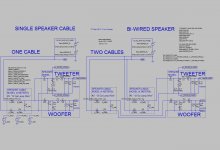
I made that rudimentary schematic just to help out for now.
jn
I actually didn't follow your sentence. Could you possibly elaborate a tad?
It could be that there would be no preference between:
1. Bi-wiring with a fully "separated" external enclosure crossover (with separated cables going into, and maintained within, the loudspeaker cabinet)., and
2. Single-wiring with a fully "separated" external enclosure crossover (with separated cables going into, and maintained within, the loudspeaker cabinet).
-by "separated" I mean a certain amount of physical separation between each crossover "leg" (ie. tweeter, mid., woofer), and a similar amount of separation between those crossover "leg's" cable-out (to their respective tweeter, mid, or woofer grouping).
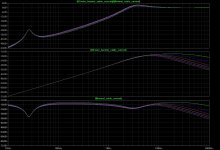
The plots in post#241 are supposed to show the response on the amplifier side of the cables right?
They are showing > 50dB response deviations.
Back in Post#213 you plotted what I think is the same parameters and only showed ~ 1dB response deviations.
What am I missing?
Well that is turning out to be an odd one. The single voltage source that I was using had also been used for time-domain ("transient") simulations, and so it had a sine wave set up, for that, on the left side of the voltage source setup window. But the "AC Analysis" supposedly uses the "AC Amplitude" and "AC Phase" fields on the right side of the box, in the "Small Signal AC Analysis" section, right?!
Well, somehow, changing the phase angle in the transient sine wave field from 90 to 0 caused the output to change, for the AC Analysis! Setting it back to 90 gave the same result as before. (But I think they're both wrong, since the gain ought to be around 41.5 dBv, I think.)
I am investigating. For example, the output level varies wildly as Phi is changed from 0 to 2 degrees. And with and without only an 8 ohm R load it's wildly different. Some change I made must have caused something pathological in my schematic. It's late and I have to go to bed now but I will post the LT-Spice files tomorrow evening.
I was using LT-Spice version 4.19i, dated July 2013. I synced to 4.19u and got no change in that behavior.
Too tired to figure anything out, tonight. Latest .asc file is attached.
Remove the ".txt" from the file name, to use with LT-Spice.
Remember to un-check all three compression options, in Tools.
Varying the PHI parameter varies the amplifier response, with minimum for PHI=0+180n and maximum for PHI=90+180n, I think.
No idea why. Need to try simple voltage sources in place of amps. But it seems to work as expected in the time domain. Probably I either did something stupid or I'm looking at it stupidly, or, much less likely, I found a bug in the software.
Cheers,
Tom
.
Attachments
Last edited:
Oops: The load2 and Vgnd2 nodes are shorted together, in that last schematic. Just cut the connection between them and the connection from Vgnd2 to the output point and then connect a new wire from the output point to the load2 wire.
Tom, I didn't investigate too far but fairly quickly found that in the bi-wiring side that nodes load2 and VGnd2 were shorted. This indicates that some sort of corruption crept into the schematic - might give you a clue ....
Edit: Well, how's about that, then ... 'something' minds think alike - you beat me by 6 mins ...
Edit: Well, how's about that, then ... 'something' minds think alike - you beat me by 6 mins ...
Thanks, Frank. That short was due to a minor change I made shortly before uploading the schematic, just to make it easier to probe the amp outputs. So the problem pre-dated that change.
I did take a couple of minutes to begin to play with using simple sine voltage sources in place of the amplifiers and maybe that would be less obfuscating anyway. I will try to look at it again tonight.
I did take a couple of minutes to begin to play with using simple sine voltage sources in place of the amplifiers and maybe that would be less obfuscating anyway. I will try to look at it again tonight.
Tom, thanks for that ... anyway, have looked a little further and there is another contributing element - the mains voltage feeding the rectifiers has a certain phase, 0 normally - change that, and the output varies. In other words, the phase relationship between voltage sources counts ...
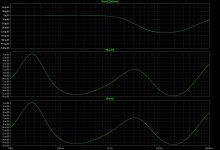
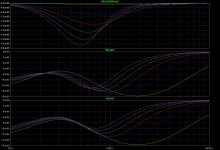
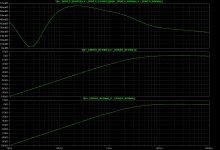
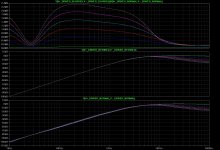
I will try that, Frank. But first, I did some runs with the amplifiers replaced with simple voltage sources.
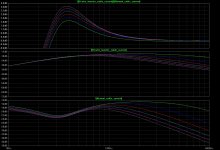
The plots with multiple runs are the usual sweep of the cable length from 13 feet to 513 feet in 100-foot increments.
The LT-Spice files need the ".txt" suffix removed, to run.
I still need to do some runs with two or more different frequencies (low and high) in each cable.
Cheers,
Tom
The plots with multiple runs are the usual sweep of the cable length from 13 feet to 513 feet in 100-foot increments.
The LT-Spice files need the ".txt" suffix removed, to run.
I still need to do some runs with two or more different frequencies (low and high) in each cable.
Cheers,
Tom
Attachments
-
BI-WIRING2c_no_amp.plt.txt830 bytes · Views: 49
-
BI-WIRING2c_no_amp.asc.txt14.1 KB · Views: 56
-
 bw_ampout_diffs_13ft.jpg394.4 KB · Views: 53
 -
 bw_ampout_diffs_13-513ft.jpg340.3 KB · Views: 46
 -
 bw_driver_V_diffs_13ft.jpg369.6 KB · Views: 132
 -
 bw_driver_V_diffs_13-513ft.jpg404.7 KB · Views: 133
 -
 bw_cable_current_diffs_13-513ft.jpg363.9 KB · Views: 137
 -
 bw_cable_current_diffs_13-513ft_detail.jpg361.1 KB · Views: 135
 -
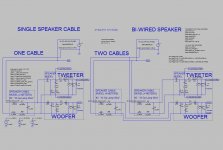 bw_schem_w-no_amps.jpg216.3 KB · Views: 137
Last edited:
I tried 80 Hz and 3 kHz together and had LT-Spice compute the THDs of the 3 KHz that ended up at the driver terminals of the single-cabled and bi-wired tweeters.
The bi-wired THD was consistently lower.
As cable length was swept from 13 feet to 513 feet, the bi-wired tweeter's THD improved but the single-cabled tweeter's THD got worse.
.step ft_cable=13
Fourier components of V(v+_driver_normal,v--_driver_normal)
Total Harmonic Distortion: 0.000567%
Fourier components of V(v+_driver_bi-wired,v--_driver_bi-wired)
Total Harmonic Distortion: 0.000556%
.step ft_cable=113
Fourier components of V(v+_driver_normal,v--_driver_normal)
Total Harmonic Distortion: 0.000634%
Fourier components of V(v+_driver_bi-wired,v--_driver_bi-wired)
Total Harmonic Distortion: 0.000549%
.step ft_cable=213
Fourier components of V(v+_driver_normal,v--_driver_normal)
Total Harmonic Distortion: 0.000693%
Fourier components of V(v+_driver_bi-wired,v--_driver_bi-wired)
Total Harmonic Distortion: 0.000544%
.step ft_cable=313
Fourier components of V(v+_driver_normal,v--_driver_normal)
Total Harmonic Distortion: 0.000744%
Fourier components of V(v+_driver_bi-wired,v--_driver_bi-wired)
Total Harmonic Distortion: 0.000539%
.step ft_cable=413
Fourier components of V(v+_driver_normal,v--_driver_normal)
Total Harmonic Distortion: 0.000789%
Fourier components of V(v+_driver_bi-wired,v--_driver_bi-wired)
Total Harmonic Distortion: 0.000535%
.step ft_cable=513
Fourier components of V(v+_driver_normal,v--_driver_normal)
Total Harmonic Distortion: 0.000829%
Fourier components of V(v+_driver_bi-wired,v--_driver_bi-wired)
Total Harmonic Distortion: 0.000532%
Attachments
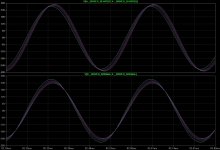
Previously, the 80 Hz and 3 kHz tones had the same amplitude, i.e. 60 V at their sources.
With the same two sine frequencies, 80 Hz and 3 kHz, but a much smaller amplitude for the 3 kHz sine source (1 V instead of 60V), the trend is more clearly illustrated.
The THD of the small 3 kHz tone at the bi-wired tweeter's terminal's doesn't get worse as cable length increases. But the single-cabled one's THD degrades with increasing cable length.
.step ft_cable=13
Fourier components of V(v+_driver_normal,v--_driver_normal)
Total Harmonic Distortion: 0.034006%
Fourier components of V(v+_driver_bi-wired,v--_driver_bi-wired)
Total Harmonic Distortion: 0.033376%
.step ft_cable=113
Fourier components of V(v+_driver_normal,v--_driver_normal)
Total Harmonic Distortion: 0.038066%
Fourier components of V(v+_driver_bi-wired,v--_driver_bi-wired)
Total Harmonic Distortion: 0.032974%
.step ft_cable=213
Fourier components of V(v+_driver_normal,v--_driver_normal)
Total Harmonic Distortion: 0.041586%
Fourier components of V(v+_driver_bi-wired,v--_driver_bi-wired)
Total Harmonic Distortion: 0.032627%
.step ft_cable=313
Fourier components of V(v+_driver_normal,v--_driver_normal)
Total Harmonic Distortion: 0.044653%
Fourier components of V(v+_driver_bi-wired,v--_driver_bi-wired)
Total Harmonic Distortion: 0.032341%
.step ft_cable=413
Fourier components of V(v+_driver_normal,v--_driver_normal)
Total Harmonic Distortion: 0.047344%
Fourier components of V(v+_driver_bi-wired,v--_driver_bi-wired)
Total Harmonic Distortion: 0.032116%
.step ft_cable=513
Fourier components of V(v+_driver_normal,v--_driver_normal)
Total Harmonic Distortion: 0.049717%
Fourier components of V(v+_driver_bi-wired,v--_driver_bi-wired)
Total Harmonic Distortion: 0.031956%
I'm not sure whether skin effect is relevant here. I don't know whether skin effect gets worse when conductors are paralleled (proximity effect) or whether it gets better. I think skin/proximity effect maybe significant in the treble, but I couldn't figure out how to calculate it. Note: I define significant as whether or not the skin effect is greater than the inductance and resistance at any point along the impedance curve of the cable.
I do know however you'll have a hard time finding a simulation model for that 3db/octave curve!!! Loudspeakers can exhibit the same 3db/oct impedance curve.
Earlier, there appeared to be impedance nulls from 100KHz to 1MHz with the bi-wiring setup. IE series resonance. Series resonance at these frequencies is the worst kind of load on an amplifier because it maximizes the possibility of oscillation. I may have been misinterpreting the charts.
Also, I think it has been brought up that loudspeakers aren't linear loads. Any nonlinearity in the speaker current may have implications for the tweeter. How to simulate a nonlinear speaker load though? How about a no-feedback class A Vfet buffer on the ground side of the speaker, serving as a nonlinear virtual ground?
The THD of the small 3 kHz tone at the bi-wired tweeter's terminal's doesn't get worse as cable length increases. But the single-cabled one's THD degrades with increasing cable length.
Where's the nonlinear component in your model? Or is this just an artifact of the slightly different frequency response?
I'm not sure whether skin effect is relevant here. I don't know whether skin effect gets worse when conductors are paralleled (proximity effect) or whether it gets better. I think skin/proximity effect maybe significant in the treble, but I couldn't figure out how to calculate it. Note: I define significant as whether or not the skin effect is greater than the inductance and resistance at any point along the impedance curve of the cable.
Dunno about proximity effect but skin effect certainly becomes an issue at the longer cable lengths that gootee has mentioned in his sims. Take 100ft - if you wanted to aim for 0.2ohm DCR round trip resistance (manufacturer's recommendation on B&W speakers), it means using 10AWG wire (1ohm per kft DCR), where skin effect begins biting into the conductance before 3kHz.
Where's the nonlinear component in your model? Or is this just an artifact of the slightly different frequency response?
I can't see any non-linearity in the model.
I am just reporting the results I get. And I have provided the models and experiment setups.
For all I know, maybe there's a non-linearity, in reality, that isn't being modeled.
Actually, a better cable model is probably needed.
Last edited:
I can't see any non-linearity in the model.
Neither can I. But you're reporting results of a sim based on that model which you've interpreted as showing a difference in THD, i.e., a non-linearity. Since you were kind enough to show your work (a rare virtue!), perhaps you or someone else who knows how to run these sims from what you've provided could see why that's there. Artifact of the sim? Result of the minor frequency response differences? The frequency spectrum of the distortion might be useful in diagnosing, but I admittedly don't understand these sim packages well enough to be telling anyone what to do.😀
I can't see any non-linearity in the model.
I am just reporting the results I get. And I have provided the models and experiment setups.
For all I know, maybe there's a non-linearity, in reality, that isn't being modeled.
Actually, a better cable model is probably needed.
Try differential subtraction of the tweeter voltages.
Do not subtract one node voltage from another...put the two terminals of each tweeter into an IA, so the tweeter drops are not referenced to ground indeendently, but reflect the current within the tweeter only.
Look at the difference waveform, and then put that into the fft.
jn
I can do that. But just FYI, what I have presented recently was all direct "ac analysis", with no time-domain simulation involved.
Wait. What is "IA"?
Wait. What is "IA"?
- Status
- Not open for further replies.
- Home
- Loudspeakers
- Multi-Way
- What does the crossover do differently when you bi-wire?