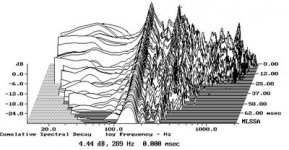
On the Z axis is the time elapsed... so farthest back is the starting point, and time elapses as you come toward the screen (or yourself).
The X axis is the frequency. The Y axis is the sound level, with the reference point at the top, and decreases as you go lower, or toward the bottom of the X-Z plane.
The X axis is the frequency. The Y axis is the sound level, with the reference point at the top, and decreases as you go lower, or toward the bottom of the X-Z plane.
That's the worst waterfall plot I've ever seen!
The top (0 ms) curve is the output of the speaker and essentially represents the steady state frequency response.
Shortly after time 0 the input to the speaker is removed and we all wish the speaker would quite vibrating at that time. Alas, it does not and the lower curves represent the ouput of the speaker at the frequencies indicated along the bottom of the graph at the time indicated along the right of the graph.
A really good speaker would have pretty much died down within a few ms.

Member
Joined 2004
Indeed that is truly horric.
I've never seen a WF extend to 60ms!!!! or even 10ms for that matter...
Which driver is that so I can avoid it like the plague? 🙂
I've never seen a WF extend to 60ms!!!! or even 10ms for that matter...
Which driver is that so I can avoid it like the plague? 🙂
Maybe, it's not that bad.
Take a look at the frequency axis. 60ms decay is at 100Hz!!
Above 1KHz the WF does not looks bad.
Take a look at the frequency axis. 60ms decay is at 100Hz!!
Above 1KHz the WF does not looks bad.
banana said:Maybe, it's not that bad.
Spot on. Unless you know what is being tested and how, you cannot make a valid "good-bad" judgement. Nor can you say much about interpretation.
bonsai, why don't you fill in the details?
Hi,
this CSD graph looks like (sub)woofer responce at listening position in (little bit) too reverberant room. (prominent standing waves at 145, 290Hz...)
Regards
Milan
this CSD graph looks like (sub)woofer responce at listening position in (little bit) too reverberant room. (prominent standing waves at 145, 290Hz...)
Regards
Milan
the speaker in question is the Athena F2, a 2 way speaker system with 2 8" bass drivers. The waterfall plot was measured by a stereophile reviewer.. "Fig.2 Athena AS-F2, cumulative spectral-decay plot calculated from the output of an accelerometer fastened to the cabinet's side panel 12" from the top. (MLS driving voltage to speaker, 7.55V; measurement bandwidth, 2kHz.)" He did a couple of other waterfall plots, but i don't really understand which is the right one to be looking at.. Here is another one of the same speaker, using different conditions " Fig.7 Athena AS-F2, cumulative spectral-decay plot at 50" (0.15ms risetime)."
Attachments

link
here is a link to his measurements too:
http://www.stereophile.com/budgetcomponents/645/index4.html
here is a link to his measurements too:
http://www.stereophile.com/budgetcomponents/645/index4.html
OK, in that case, what this plot is telling you is where the natural resonant frequencies of these panels are and their relative magnitude. Because that sort of accelerometer is not calibrated, you can't really judge how dead the panel is, just where the modes are. The ideal cabinet would give zero output at all times and at all frequencies.
The thing you can do to get an idea of the relative severity of those panel modes is to replot the impedance magnitude and phase data on a complex Z plane (Stereophile, for some reason, doesn't do this, despite it being a superior way to visualize an impedance plot). You'll see a series of big circles, which represent the fundamental speaker resonances. Look at the frequency where the waterfall plot shows a ridge; if the Z plot shows a little circle or kink there, the panel resonance is probably significant and ought to be dealt with. If the Z plot is smooth there, the resonance is probably insignificant.
The thing you can do to get an idea of the relative severity of those panel modes is to replot the impedance magnitude and phase data on a complex Z plane (Stereophile, for some reason, doesn't do this, despite it being a superior way to visualize an impedance plot). You'll see a series of big circles, which represent the fundamental speaker resonances. Look at the frequency where the waterfall plot shows a ridge; if the Z plot shows a little circle or kink there, the panel resonance is probably significant and ought to be dealt with. If the Z plot is smooth there, the resonance is probably insignificant.
Looking at the Z magnitude measurement in the review you linked to, it's easy to see the wriggles even without going to a full complex Z plot. That cabinet has a severe case of the shakes.
454Casull said:On the Z axis is the time elapsed...
IMP waterfall plots are much more useful when the z-axis is plotted in cycles instead of time ... it gives you a much more accurate impression of the decay characteristics of the driver, and way more resolution in the high frequencies where, often, the most severe problems are.
An externally hosted image should be here but it was not working when we last tested it.
(from accuton website)
dave
what it all boils down to is, would you buy these speakers? stereophile gave them a good review, and they sound very nice to the ears..
on sale too
they are normally $600 a pair, and are going for about $360 a pair new at best buy (they are trying to sell them off maybe?) of course, most best buy shoppers wouldn't spend $600 on a pair of speakers.. with that price in mind, are those box resonances acceptable? It would seem that only the most expensive speakers could be made with minimal box resonances..
they are normally $600 a pair, and are going for about $360 a pair new at best buy (they are trying to sell them off maybe?) of course, most best buy shoppers wouldn't spend $600 on a pair of speakers.. with that price in mind, are those box resonances acceptable? It would seem that only the most expensive speakers could be made with minimal box resonances..
Re: on sale too
Only you can decide... but these would be classified as reletively cheap speakers, so they have no doubt not taken all posssible measures to kill box resonances. If you buy them some after the fact DIY can probably improve their performance an order of magnitude.
IIRC Athena is a brand-name of the very large Canadian manufacturer that is known for really good bang-for-the-buck products.
dave
bonsai171 said:they are normally $600 a pair, and are going for about $360 a pair new at best buy (they are trying to sell them off maybe?) of course, most best buy shoppers wouldn't spend $600 on a pair of speakers.. with that price in mind, are those box resonances acceptable? It would seem that only the most expensive speakers could be made with minimal box resonances..
Only you can decide... but these would be classified as reletively cheap speakers, so they have no doubt not taken all posssible measures to kill box resonances. If you buy them some after the fact DIY can probably improve their performance an order of magnitude.
IIRC Athena is a brand-name of the very large Canadian manufacturer that is known for really good bang-for-the-buck products.
dave
controlling box resonances
what things could be done to control any resonances in the boxes? short of screwing more bracing into the box or something permanent like that..🙂
what things could be done to control any resonances in the boxes? short of screwing more bracing into the box or something permanent like that..🙂
Re: controlling box resonances
That is step 1 -- they should be glued as well. 3/4" x 1 1/2" oak (or other hardwood) strips are good (feed as long as you can thru the woofer cutout. Braces should be at an angle relative to the panel edges.
A brace from the speaker magnet to the back of the box is also useful.
dave
bonsai171 said:what things could be done to control any resonances in the boxes? short of screwing more bracing into the box or something permanent like that..🙂
That is step 1 -- they should be glued as well. 3/4" x 1 1/2" oak (or other hardwood) strips are good (feed as long as you can thru the woofer cutout. Braces should be at an angle relative to the panel edges.
A brace from the speaker magnet to the back of the box is also useful.
dave
vuki said:It looks like panel vibration measurement waterfall.
bonsai171 said:"Fig.2 Athena AS-F2, cumulative spectral-decay plot calculated from the output of an accelerometer fastened to the cabinet's side panel 12" from the top. (MLS driving voltage to speaker, 7.55V; measurement bandwidth, 2kHz.)"
Vuki is a winner!
(Danas opet ja placam kavu.)😉
- Status
- Not open for further replies.
- Home
- Loudspeakers
- Multi-Way
- waterfall plots