planet10 said:This isn't an impedance plot, but is how they should look... rotate so one axis disapears (ie look down the spiral) and you have the plot SY is talking about, make any of the other axes dissapear and you have the amplitude or phase plots.
I was in a bit of a hurry yesterday, so my reply was a lot more opaque than I would have liked; thanks for the illustration.
Dick Heyser wrote a wonderful article for Audio called "Impedance: More than one number?". I don't have a reference, but it was about 20 years ago- a few minutes in a library ought to tun it up. It gives a really lucid explanation of complex impedance plots. They're also covered (as are waterfall plots and their interpretation) in Joe d'Appolito's wonderful book "Testing Loudspeakers".
Nautaloss II speaker waterfall plot?
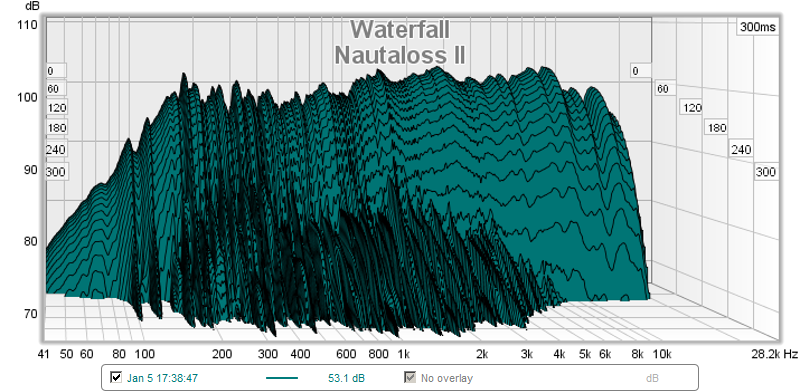
I posted this in the Full Range forum hoping to get some feedback on the waterfall plots for my new speaker but no comments so far. I am new to waterfall plots so hoping someone can help me figure out if this looks good and what can be improved.
The waterfall looks like this:
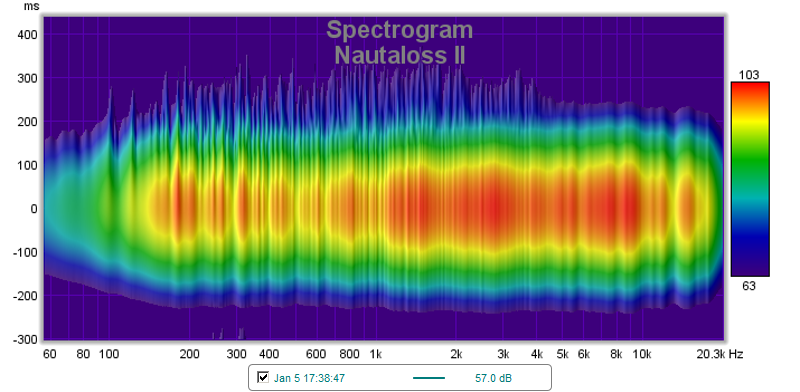
The equivalent spectrogram contour plot looks like this:
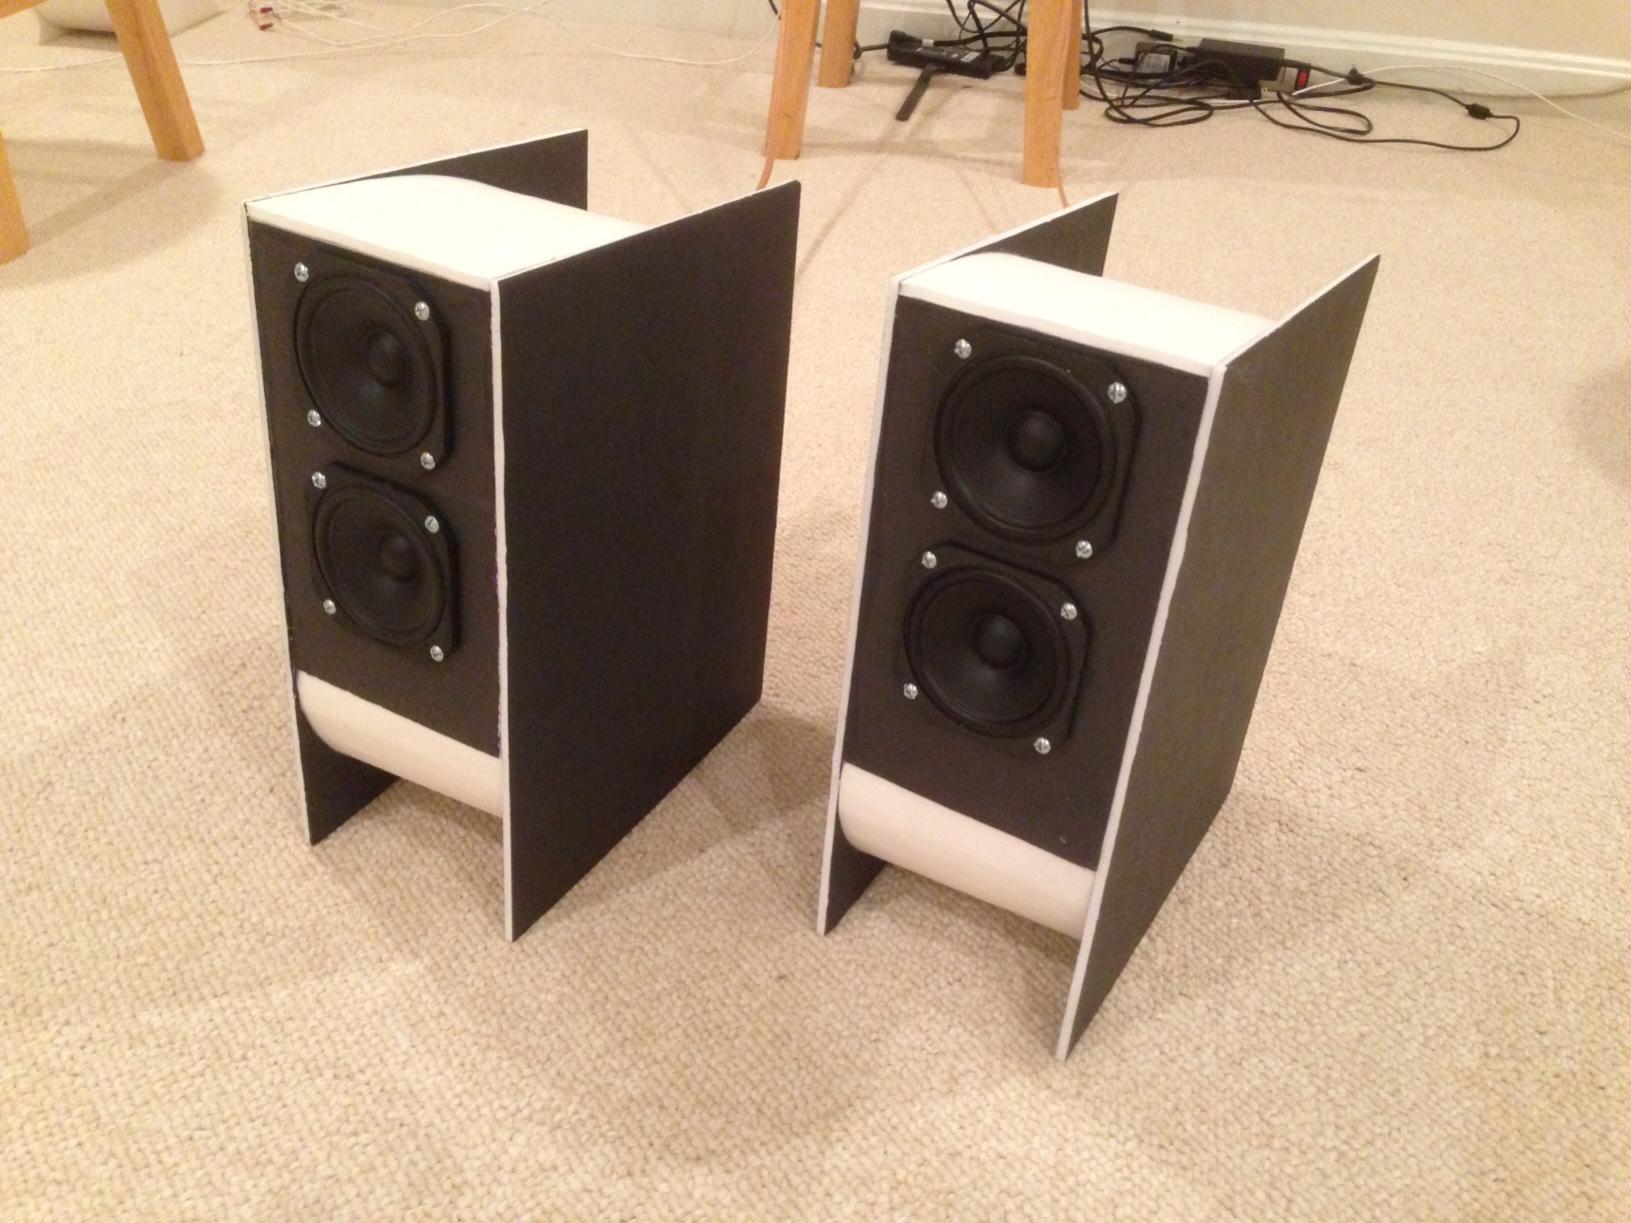
The speaker is the Nautaloss II (a sealed spiral TL full range) for 200 Hz to 18kHz range to be used with a sub.
Nautaloss II ( http://www.diyaudio.com/forums/full-range/247598-nautaloss-ref-monitor-10.html#post3762442 ):
Thanks in advance,
Xrk971
I posted this in the Full Range forum hoping to get some feedback on the waterfall plots for my new speaker but no comments so far. I am new to waterfall plots so hoping someone can help me figure out if this looks good and what can be improved.
The waterfall looks like this:
The equivalent spectrogram contour plot looks like this:
The speaker is the Nautaloss II (a sealed spiral TL full range) for 200 Hz to 18kHz range to be used with a sub.
Nautaloss II ( http://www.diyaudio.com/forums/full-range/247598-nautaloss-ref-monitor-10.html#post3762442 ):
Thanks in advance,
Xrk971
Yep, Stereoplie's Atkinson likes these panel vibration measurements. He takes them all around sides and then chooses one to be published.
"Time domain"
Waterfall decay/spectrum plots, csd plots are used for many reasons and in many different scales. In generalt they tell how long a signal plays. Long "tail" may come from driver ringing, cabinet ringing etc. reasons for "energy storage" (in short time scale up to 3-6ms)
Longer time scale up to 1000ms is used for room measurements.
To xrk971,
Only nearfield, short time scale (up to 3-6ms) decay response measurements can be compared to each other. They tell how the speaker behaves. All other measurements include reflections from nearby boundaries and room reverberation, they tell how the speaker works in a room.
I guess that you have taken several measurements, they will all look different! Try to standardize your own measurement protocol. Then, change some (one) parameter and measure again, look at differencies.
Looks like you are using REW. Toggle the gear symbol and change analyzing parameters, you will get amazingly different Graphics from the same measurement sweep, specially with decay spectrogram! This spectrogram is actually a "wavelet transform" presentation and it is very useful but need lots of learning to be understood. Please study the help pages of REW!
Thanks for the reply juhazi. The measurements were made with mic 12in away or at about 9 ms. I could move it closer to get 3 ms as you say (4 in away) and try again. Is it also important to make measurements outdoors to have useful energy decay data? Or does moving mic to nearfield at 3 ms away solve this? I think the waterfall, decay spectrogram, and cumulative spectral decay plots are all different presentations of same wavelet transform. I see spectrogram as simply top view color contour plot of waterfall. The features line right up. My question is whether or not a speaker with energy storage that lasts 100 to 200 ms is good and is that coming from the speaker or the room? At 9ms away, you are saying it may be the room?
I was in a bit of a hurry yesterday, so my reply was a lot more opaque than I would have liked; thanks for the illustration.
Dick Heyser wrote a wonderful article for Audio called "Impedance: More than one number?". I don't have a reference, but it was about 20 years ago- a few minutes in a library ought to tun it up. It gives a really lucid explanation of complex impedance plots. They're also covered (as are waterfall plots and their interpretation) in Joe d'Appolito's wonderful book "Testing Loudspeakers".
Another project for the folks at Elektor -- archiving the technology oriented articles from Audio. I think that the successor publication is Sound and Vision.
Atkinson wrote a series of articles "Measuring Loudspeakers" in which he discussed waterfall plots. They are on the Stereophile website.
About room measurements Measuring Room Acoustics - Gearslutz.com
About speaker measurements specially decay Measuring Loudspeakers, Part Two | Stereophile.com
Measuring distanve is important too http://www.audioholics.com/loudspeaker-design/audio-measurements/audio-measurement-techniques
About speaker measurements specially decay Measuring Loudspeakers, Part Two | Stereophile.com
Measuring distanve is important too http://www.audioholics.com/loudspeaker-design/audio-measurements/audio-measurement-techniques
Last edited:
This isn't an impedance plot, but is how they should look... rotate so one axis disapears (ie look down the spiral) and you have the plot SY is talking about, make any of the other axes dissapear and you have the amplitude or phase plots.
dave
Someone resurrected this thread, and I happened to see this post from Planet10. This is one of my favorite type of plots showing the complex nature of a waveform:
I think that the complex signal (the spiraling thingy at center) is just being decomposed into/projected onto its real and imaginary parts/planes. Those quantities are not phase or amplitude, they are the real and imaginary components. The amplitude is the magnitude of the complex signal, which you can interpret as the distance from the central axis around which it is spiraling to the signal at any point in time, which is a line segment. The phase is the angle that segment makes to a certain reference axis (e.g. positive "doublet" axis type of orientation in the figure) which is defined as the 0 degree phase angle. Of course there are the mathematical equations that can be used to calculate amplitude and phase, but its also good to know how these quantities are represented in this kind of plot.
I always found a certain beauty in signals explained in this way, but the amplitude + phase representation is easier to interpret in meaningful ways.
- Status
- Not open for further replies.
- Home
- Loudspeakers
- Multi-Way
- waterfall plots