We can give this thread a try. The idea is that Vituixcad newbies who have a fair understanding of speaker making concepts but are amatuers with Vituixcad can ask away for basic help. It might even help keeping it as an accessible source for a Vituixcad manual.
Of course we would like the veterans to keep an eye out that the right thing is taught so hoepfully they subscribe to the thread and keep checking in.
Of course we would like the veterans to keep an eye out that the right thing is taught so hoepfully they subscribe to the thread and keep checking in.

A 0 degree axis measurement is fairly non-representative of power in the band (one reason shown below). It also shows nothing of any consequence in the breakup region.
However if you must use it, and you take these things into account.. eg: cross before breakup, design for consistent directivity, then you reduce these issues.

However if you must use it, and you take these things into account.. eg: cross before breakup, design for consistent directivity, then you reduce these issues.
Last edited:
No it won't show anything useful in the directivity window with a single response as there is no directivity to show. You either need to have measured off axis angles or use the diffraction tool to create something based on the on axis response and drivers physical size.I have uploaded an FRD file but only on axis and for the tweeter and woofer, should the directivity graph still have something to show?
The first option is how it is meant to be done.
So, can we use the SPL Trace for off axis measurements? Or better still does the diffraction tool take in consideration a a waveguide?
If not then I have to go back to basics and take off axis measuremements, which isn't too hard to do. Just need to accurately move the speaker to the correct degrees. There is a manual somewhere on this forum, I will search for it.
If not then I have to go back to basics and take off axis measuremements, which isn't too hard to do. Just need to accurately move the speaker to the correct degrees. There is a manual somewhere on this forum, I will search for it.
Technically, I am just trying to learn VituixCAD so I am happy to continue with the basics and just move forward with adding biquads, setting delay etc etc but I will see if I can take off axis measurements without too much trouble.A 0 degree axis measurement is fairly non-representative of power in the band (one reason shown below). It also shows nothing of any consequence in the breakup region.
However if you must use it, and you take these things into account.. eg: cross before breakup, design for consistent directivity, then you reduce these issues.
View attachment 1105509
Yes you can but they are often limited which will create a lot of interpolation in between, if you mean manufacturers measurements they are often infinite baffle so need diffraction added. Anything that isn't measured with a timing reference is hard to work with, trying to force minimum phase responses and simulating driver offsets sort of works but can't really be trusted as accurate.So, can we use the SPL Trace for off axis measurements?
No piston size onlyOr better still does the diffraction tool take in consideration a a waveguide?
This is the best way to go in any case to use the program in the way it was designed for.If not then I have to go back to basics and take off axis measuremements, which isn't too hard to do. Just need to accurately move the speaker to the correct degrees. There is a manual somewhere on this forum, I will search for it.
Member
Joined 2003
VituixCAD's intent is to be used with real measured data of your real speaker in your real cabinet. This provides the greatest accuracy of filter simulation with minimal assumptions or calculated data. It does however provide some tools for tracing data, but these tools should really be used for educational purpose only, not for real design work of a speaker you intend to build and enjoy for years to come.
Traced data includes many shortfalls. To answer your first question, a single on-axis response loaded into VituixCAD will not provide any directivity information, it will be treated as a "point source", since there isn't enough information available to provide anything more than that.
The diffraction tool will provide some off-axis capability, but it is mathematically derived from a "piston" model, meaning it assumes the driver diameter you've provided to the diffraction tool is a perfect flat hard piston, so you can guess there will be some error in this result, especially at higher frequencies. Speaker cones are not pistons, so the driver specific directivity behaviour and complex breakup off-axis will not be considered in this simple math.
Traced data also will not include the acoustic delay that exists between multiple drivers in a complete system, it is simple a calculated "minimum phase", so correct delay will not be available, some basic assumptions can be made but without real measurement you are just guessing. For this and the above reasons, real measurement following the measurement guide(s) for VituixCAD is the correct process for any real design work.
I have assembled an instruction on working with traced data, which stresses the above shortfalls in the first page. It is provided as a learning tool while you wait for your mic and audio interface to arrive in the mail.
You can find this document at the link below:
https://drive.google.com/file/d/1j9leycXJNvUmYZxQNVqg8U13mMRHh8Iw/view?usp=share_link
Additionally, some reference material for acoustic measurement and using some of the more advanced features of VituixCAD are included here:
https://drive.google.com/drive/folders/1KDyECkAIVAuNEtKVobKmsfvtFczGqOQw?usp=share_link
Measurement Guide's and more help for VituixCAD can be found here:
https://kimmosaunisto.net/Software/VituixCAD/VituixCAD_help_20.html#How_to_start_with_VituixCAD
Not really, it is better to measure with a higher sampling rate to make sure that anything related to the DAC's own filters is out of the way of the audio band and breakup resonances or other stuff is captured, but you can happily make good and useful measurements at 44.1K, don't let that stop you.
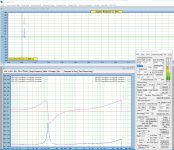
The measurement chain should maintain positive polarity, but that can be corrected for later as long as it is always the same.Thanks for the tip. However, the loopback test (SoundEasy v27) showed rising phase. I went to my PC sound card and got sampling at 96,0000 Hz but inverted signals. Is this gonna mess up phase measurement later? Can i just keep keep them them inverted and go on?
I don't have any experience with SoundEasy but if something in the measurement chain has a band limiting filter then that will introduce a visible phase change, this is an example of a 2nd order filter at 22,050Hz, you can see the phase change well within the audio band.
If you invert it it looks quite different.
Member
Joined 2003
Loop back is good enough, if I recall there’s some options in the preferences to invert signal and/or reference signals. It’s not a big deal but for consistency should try and keep all impulse response with positive peak.Thanks for the tip. However, the loopback test (SoundEasy v27) showed rising phase. I went to my PC sound card and got sampling at 96,0000 Hz but inverted signals. Is this gonna mess up phase measurement later? Can i just keep keep them them inverted and go on?
View attachment 1108957
Thanks Dcibel-found those invert buttons. John-K, in a long ,lost post, also says inversion does not matter as long both channels have the same polarity.
https://www.diyaudio.com/community/threads/help-measurin-imp-in-soundeasy.139232/page-4
Impedance and phase overlay whether the impulse is positive or negative (positive shown).
https://www.diyaudio.com/community/threads/help-measurin-imp-in-soundeasy.139232/page-4
Impedance and phase overlay whether the impulse is positive or negative (positive shown).
Attachments
TITLE: Cannot align tweeter phase after IR inversion from negative to positive
While newbies are not likely to have SoundEasy, they may very well measure with an internal sound card that inverts the data and ref IRs. Hopefully, with input with senior users, a way forward can be clarified.
Included below, are screen shots of tweeter FR and phase generated from IRs imported form SEv27. Phase is easily aligned when the impulses are negative and non inverted (A). However, after inversion, I cannot obtain reasonable phase alignment (B). By invoking the 'invert' command in Vituixcad , the IR of 'B" is now easily aligned. What to make of this data? Just leave the IRs non-inverted in SE then import?--Barry
Member
Joined 2003
What exactly are you trying to align here? Measured phase with minimum phase? Min phase is mostly pointless, just hit the "Far 1" button, adjust right window and go. Since your response <500Hz is quite high, you might try the "DC offset" button to see if it provides a better low frequency roll off. The measurement guides will have you try to get a near min phase result, but this is only for ease of chart viewing, really you can just hit FAR 1 and be done with it. Result of response C is perfectly fine, I'm not sure what's going on in response A to have caused a null at 280Hz.
The only real application to reference minimum phase would be for combining multiple near field measurements like driver + port, because the mic will have been moved and the acoustic delay is irrelevant for near field, its good to align the measurements to min phase for best combined result.
FWIW, response A and C are both in positive phase, B is inverted, you will notice the phase is roughly 180 degrees from the min phase result, as well the impulse and reflections shown are both downward facing.
Last edited:
Hi, im am a newbie so i want to ask does this project look ok?
Im not going to build it since this is learning to use program project, but i will build my next 2way design after this, so..
If someone can look at this screenshot and tell me are there gaping mistakes, i would apreciate it!
Im not going to build it since this is learning to use program project, but i will build my next 2way design after this, so..
If someone can look at this screenshot and tell me are there gaping mistakes, i would apreciate it!
Attachments
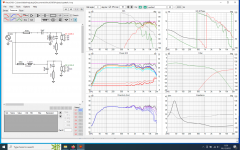
avoid the series resistors for the midbass!does this project look ok?
use a lower crossover frequency to avoid influence of midbass breakup.
- Home
- Design & Build
- Software Tools
- VituixCAD For Newbies