Geesh, you'd think you were doing server performance analysis!! 🙂arrival rate.
I'm sorry, I clearly meant arrival times, not rates 😆
Yes, you don't need to know delay unless you are unable to measure it in the proper way.so the delays are included
Finding phase, or a frequency, is always more accurate when using a null type procedure, so you might keep that in mind as a cross check. However it's possible to get the delay wrong and have a false positive since a null type procedure is a poor indicator of the slope over a wider band.Thats a really neat method for finding offset!
However it's possible to get the delay wrong and have a false positive since a null type procedure is a poor indicator of the slope over a wider band.
I don't see these as exclusive but rather chicken and egg issues. First I gather the offsets, the design the crossover, then check via nulls. 🙂 I have to say I've found this method exceptionally accurate in the passive crossover domain.
None of my this transferred well to DSP-land however. 😆 I had to observe the impulse response, estimate the difference, add the delay and then shift left and right for maximum nullness.
It should again not be necessary to check nulls unless you have been unable to measure properly. Nulls are not part of a good crossover either.
I’m surprised you don’t get the same results with DSP. In any case I’m tied up right now. I want to post an example of how null testing can be unclear with delay, I’ll do that a bit later.
I’m surprised you don’t get the same results with DSP. In any case I’m tied up right now. I want to post an example of how null testing can be unclear with delay, I’ll do that a bit later.
Don’t understand how using correlation between measured result and modeled result can be wrong procedure?
Then inverting one filter to check result for cancellation is a nobrainer for me if I use classic filters.
Trust but veryfy
Then inverting one filter to check result for cancellation is a nobrainer for me if I use classic filters.
Trust but veryfy
No one is saying it's wrong? Just pointing out the things to watch out for.between measured result and modeled result can be wrong procedure?
Classic Butterworth is 90/270 degrees out of phase.inverting one filter to check result for cancellation is a nobrainer for me if I use classic filters.
You may also use the tweeter of the speaker under development itself as helper tweeter by feeding it through a highpass with a much higher cutoff frequency than the one you will use in the end. You can also reduce its level in order to interpret the results more easily.All responses must have the same timing reference, obviously. I sometimes used a helper tweeter nearby to create a marker pulse present in all recordings. Don't move neither mic nor helper tweeter when changing setup for a different driver.
Regards
Charles
OK, agree.Classic Butterworth is 90/270 degrees out of phase.
So holds only for LR or other filters that has n x 180 degrees constant phase difference.
So one need to know at what pase difference cancellation occure and use that value
I could simulate it but it would look exaggerated because we are so good at seeing straight and non-straight lines 😉 I would suggest you mess with delay a little on any design you have on Xsim or Vcad.
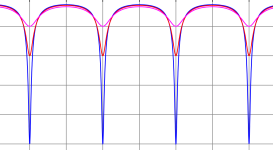
I'm not saying it can't be done.. I'm just saying that phase at near summation reduces in resolution. I could better make my point with comb filtering by saying consider the difference in amplitude spanning a tenth of a wavelength in the plot below, at the cancellation, compared to across the flat top.

I'm not saying it can't be done.. I'm just saying that phase at near summation reduces in resolution. I could better make my point with comb filtering by saying consider the difference in amplitude spanning a tenth of a wavelength in the plot below, at the cancellation, compared to across the flat top.

Yes, maybe it is possible in anechoic chamber and infinite baffle. But elements placed in a box and box in a room, the signature of that measurement is so unique that the correlation is only good at one xyz point only. And the only moving parameter is z
Of cource it requires that the measuring system has a stable latency.
Of cource it requires that the measuring system has a stable latency.
^^ If one does spinorama with dual channel measurement method, each driver spun mic at on-axis height, it'll enable simulator to show quite close approximation toward any observation angle assuming the data is good. I mean you can see pretty clearly what the sound is standing up for example, and you can can see optimal listening height for any passive xover, or optimize the xover some particular listening height, find out required tilt or how much you'd need to off-set a driver physically, and so on. All kinds of stuff possible, while some of it might need rebuilding the system it's still quite amazing to have such data available and visible in simulator.
Although only the main axis (ver and hor) are measured and accurate, and all the other data (response to arbitrary direction that is not at hor or ver axis) is interpolated with some error to reality. Meaning that you can look simulated anechoic response for stand up position 20deg off-axis at 4 meter distance. Even though there is no measurement for it it's still relatively accurate, assuming phase/delay stuff is correct in the data, measurement method closely followed. Imagine calculating acoustic off-sets by hand for ~36 ver and ~36 hor measurements, for each driver :S
What I'm trying to message here is that one can do what ever they wish, but it is really powerful to try and get best possible data to be well informed and then able to make good outcome.
Last edited:
Looks like I started another long thread, sorry. 🙂 Those who point out that not all crossover designs will have a null when a driver is inverted are of course correct. Sorry for my over simplifications. To illustrate my original point though I put together some charts from one of my speakers, minus the crossover parts. This design uses an AMT tweeter with 7" mid-woofer:

The sim of the schematic (above) has the individual frequency response and impedance measurements associated with each driver at the starting point.
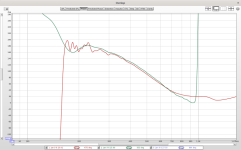
In the chart below I show the XSim simulation with no woofer delay in black and the actual in green. The green one is pretty much what I measured driving both drivers at the same time without a XO. At this point we note that while the simulation starts assuming no delay the reality is that there is an unknown amount of delay and therefore the simulation and reality won't yet match.
By incrementally adding delay to the woofer the black line will become the green line.
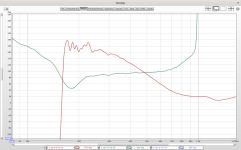
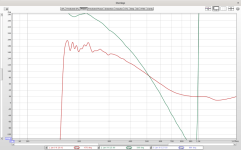
I hope this helps demonstrate how these measurements add up:

Below the combined plots I added the individual driver measurements in yellow and blue.
Worth pointing out that the sonic signature in the overlap area (~2-7kHz) isn't really part of either driver but it's own unique result. To me these look like ridges on a house key. All measurements were taken at 1m at the middle of the tweeter's vertical axis. Also worth noting that the ugliness of the green line is completely eliminated once the actual crossover is put into place.
Though not all crossover designs will null when inverted, the simulation should match either state.
The sim of the schematic (above) has the individual frequency response and impedance measurements associated with each driver at the starting point.
In the chart below I show the XSim simulation with no woofer delay in black and the actual in green. The green one is pretty much what I measured driving both drivers at the same time without a XO. At this point we note that while the simulation starts assuming no delay the reality is that there is an unknown amount of delay and therefore the simulation and reality won't yet match.
By incrementally adding delay to the woofer the black line will become the green line.
I hope this helps demonstrate how these measurements add up:
Below the combined plots I added the individual driver measurements in yellow and blue.
Worth pointing out that the sonic signature in the overlap area (~2-7kHz) isn't really part of either driver but it's own unique result. To me these look like ridges on a house key. All measurements were taken at 1m at the middle of the tweeter's vertical axis. Also worth noting that the ugliness of the green line is completely eliminated once the actual crossover is put into place.
Though not all crossover designs will null when inverted, the simulation should match either state.
Last edited:
PS - Anyone who wants to experiment with this for free I suggest grabbing using XSim, then get download the FRD data for a couple of Dayton drivers, say a 5"-6" midwoofer and a dome tweeter (or whatever, files are free) and add 1.25-1.5" to the woofer distance. You will now have a very useful simulation of what goes on with acoustic offsets.
- Home
- Loudspeakers
- Multi-Way
- Understanding acoustic offsets vs. group delay with LR4


