Looks like audio was only recorded in the right channel, while Scott's code reads the left.
All these details, the one choice out of 4 that won't work.
sig = y[1][:,0][0:int(Fs*4)] #Grab 4 sec of a stereo file from the first (left?) channel
sig = y[1][:,1][0:int(Fs*4)] is 4 sec of the right channel
The glitch still turns up on some files so tomorrow I will post a permanent fix as well as incorporate the mean frequency readout suggested. The FFT plot will take a while.
Last edited:
Thanks JP,
that looks even worse than it sounds! (the particular testtone)
Since i have mostly test-records with an 1kHz Testtone -- is the script tweakable to this?
R.
that looks even worse than it sounds! (the particular testtone)
Since i have mostly test-records with an 1kHz Testtone -- is the script tweakable to this?
R.
Thanks JP,
that looks even worse than it sounds! (the particular testtone)
Since i have mostly test-records with an 1kHz Testtone -- is the script tweakable to this?
R.
Yes, the one I will put up tomorrow will do that and any RPM and the edits are clearly marked. So 1K and 1Hz steps is easy. See for instance post #580
Last edited:
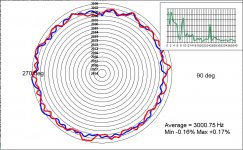
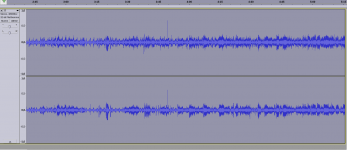
Now I got it -- this is the same track this time with a weight clamp fitted.
A bit better, however, it shows clearly why I was uneasy with the deck lately!
It is with a Yamaha GT2000, and it should definitely perform better.
Is there a pattern to recognize out of the plot of what might go wrong?
EDIT: it is not only wandering quite a bit, it is at the same time high-pitched (around 3015 Hz instead of 3000Hz) (PLL-Lock LED is on)
R.
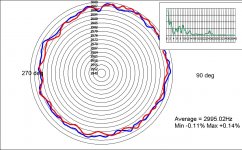
Attachments
Last edited:
EDIT: it is not only wandering quite a bit, it is at the same time high-pitched (around 3015 Hz instead of 3000Hz) (PLL-Lock LED is on)
R.
I'm beginning to have trouble trusting some of the test LP's. It's very easy to generate a cal file digitally and it is right on.
I think a lot of test records are highly suspect.
Sparkfun decided to ship my box of toys via smartpost, so they won't arrive until Monday. I decided to come back to the city today, and we're in Vermont next weekend, so it'll be a couple weeks until I capture my test records.
Sparkfun decided to ship my box of toys via smartpost, so they won't arrive until Monday. I decided to come back to the city today, and we're in Vermont next weekend, so it'll be a couple weeks until I capture my test records.
Last edited:
Erm... and how to transfer this file on a Test-LP?
However, this particular one is not only eccentric but with a slight [insert english expression for 'Höhenschlag' here] as well which may at least in part explain what is going on.
However, this particular one is not only eccentric but with a slight [insert english expression for 'Höhenschlag' here] as well which may at least in part explain what is going on.
Höhenschlag = Runout "a slight error in a rotating tool, machine component, etc., such as being off-center or not exactly round."
What i was trying to say was that the eccentricity is not only lateral but up and down as well... 
Put a normal record on and record the sound of the run off groove with Audacity for about a minuteEDIT: it is not only wandering quite a bit, it is at the same time high-pitched (around 3015 Hz instead of 3000Hz) (PLL-Lock LED is on)
R.
You should be able to see a ~1.8 second repeating glitch. Measure the time for ten rotations and calculate the actual true rpm
Some test records are very inaccurate - they belong to a time of analog function generators where 1% accuracy was good
Some record decks run a little fast by design - a trick that won comparative reviews by sounding "faster and more dynamic"
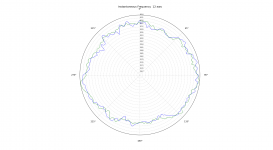
Looks fine and should be workable.
I have generated the two wav's with the test LP at 0 and 90 degrees clockwise, position pulse on the right channel - trust these are workable. A plot of one test is shown.

View attachment Lenco3000HZ-LP_0deg_24092017.zip
View attachment Lenco3000Hz-LP_90degcw_24092017.zip
Regards,
Yes! The platter itself, as well as the record.What i was trying to say was that the eccentricity is not only lateral but up and down as well...
Such basic things as this, and along with record centring, account for the biggest cause of pitch variation by magnitude. Fortunately, often easy to spot and remedy so long as the cause of vertical runout isn't something bent...........
LD
Thanks, FBL.I have generated the two wav's with the test LP at 0 and 90 degrees clockwise, position pulse on the right channel - trust these are workable. A plot of one test is shown.
View attachment 636995
View attachment 636996
View attachment 636997
Regards,
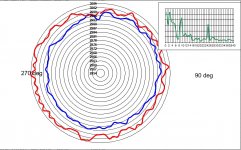
Here's polar plots for those files. 12 O'clock is the leading edge of the index pulse, blue and red 2 successive revolutions - except the 3rd plot has the 1st revolution from each file. I took the leading edge of 1st index pulse in the files as the start of data.
You'll see that several odd things appear to have happened: the 0 deg file speed is significantly slower than the 90 deg file, and the eccentricity has moved by nearer 180 deg than 90 deg.............
Otherwise, the spectrum looks very like a Lenco - that characteristic ~ 25Hz variation from the motor shaft. It looks quite healthy, though - I've seen far worse Lenco's by measurement, and I've never seen one without the ~25Hz content. I'd assume the ~9Hz content to be cart/arm resonance, but can't remember how many poles the Lenco motor has (4 I think?).
Any ideas what else might have happened between recording the 2 test files ?
LD
Attachments
Last edited:
OK trying to understand analysis of polar plots ...
1) Wavyness is speed drifts
2) Offcenter is graph circle moving away from the center
3) 0 to 90 degree slow speed as LD says in above plot is represented by that portion of the graph has moved further away from center compared to other portions.
4) 25 hz variation is shown in 2 axis graph as bump
am I right ?
what other things can be interpreted ?
Regards.
Put a normal record on and record the sound of the run off groove with Audacity for about a minute
You should be able to see a ~1.8 second repeating glitch. Measure the time for ten rotations and calculate the actual true rpm
Some test records are very inaccurate - they belong to a time of analog function generators where 1% accuracy was good
Some record decks run a little fast by design - a trick that won comparative reviews by sounding "faster and more dynamic"
Hm, I don't see such a thing as a 'repeating glitch' (and why should it be there, really?). Maybe you could give me hint what to look for?
1% accuracy -- good point. Would it also allow the FG to wander around? (I guess not, my ancient FG's at my workbench do not)
i don't believe the GT2000 is wrongly pitched -- too much to loose for suppossed japanese top-end gear. (People used to play along their musical instruments back in the day and a wrong pitch would be out of the question for a deck without manual pitch control. At least i hope so.)
Attachments

... how to know vertical eccentricity of the platter ?
I'd say this would be instantaneously visible by the pure eye. In my case, you don't see the platter moving if its spinning. But I easily spot the movements of the cartridge riding the grooves.
In the circular it should model as an eccentric circle as well, shouldn't it?
In the circular it should model as an eccentric circle as well, shouldn't it?
Yes but there's a built in slight distortion in doing the polar projection with a purely linear radial dimension that makes it slightly elliptical. BTW I think the comment on the leadout groove was related to the fact that it is locked and usually there is a click where the stylus enters. You might have to listen and zoom in to find it. OTOH you could take a trash record and put a scratch on it, usually you can get a time measurement down to one sample period.
Last edited:
- Home
- Source & Line
- Analogue Source
- Turntable speed stabilty