I am trying to learn ngspice because it is open source and free. Unlike LTSpice I have to type the netlist directly as a text file which is boring and very prone to errors. Are there any graphical software tools I can use to graphically create .cir files?
I think KiCAD can spit out a netlist. Whether it's a spice compatible netlist I don't know.
An alternative could be QSpice, which looks to be a competent simulator. It's written by the same guy who wrote LTSpice. https://www.qorvo.com/design-hub/design-tools/interactive/qspice
Tom
An alternative could be QSpice, which looks to be a competent simulator. It's written by the same guy who wrote LTSpice. https://www.qorvo.com/design-hub/design-tools/interactive/qspice
Tom
I would think KiCAD can spit out a spice compliant netlist. I use ngspice and it works pretty well. I've not had convergence issues. My software writes a compliant ngspice netlist, not that uncommon. It is a pretty generic spice format.
Alas, QSpice requires Windows so I guess we Linux fans need to learn the KiCad way.I think KiCAD can spit out a netlist. Whether it's a spice compatible netlist I don't know.
An alternative could be QSpice, which looks to be a competent simulator. It's written by the same guy who wrote LTSpice. https://www.qorvo.com/design-hub/design-tools/interactive/qspice
Tom
That is not a problem I am already running LTSpice in Devuan GNU/Linux. For MS Windows program there is WINE which is an implementation of the Windows API. Although I can use LTSpice and actually know how to input schematics and run commands to simulate them, I want to enrich my knowledge by learning ngspice. I know, there are people who use Linux for political reasons: however, I am not one of them. If I need to use Windows, I use it. After all, it is a tool.Alas, QSpice requires Windows
There seems to be quite a few GUI programs that use ngspice these days. Interesting to see Autodesk is one of the them.
Mac fans too. Though, I had good luck with Wineskin and TINA-TI: https://neurochrome.com/pages/running-windows-programs-on-mac-for-freeQSpice requires Windows so I guess we Linux fans need to learn the KiCad way.
I'm curious if the model import by drag-n-drop in QSpice will work with Wine.
Tom
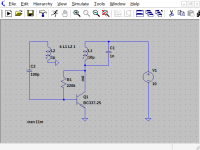
I am testing my first netlist that I created using LTSpice and its ability to export Accel nets. I converted the netlist into a ngspice file using my custom application. This is a single transistor oscillator which I designed using an RF transformer. The following code is the .cir file.
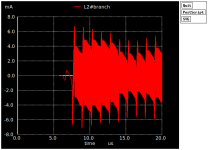
At this point I am comparing LTSpice with ngspice. Using the command "plot L2#branch" gives the attached graph. What is happening? Is this an ngspice bug? The graph implies there is a very high frequency acting on the base. I am also attaching a snapshot of LTSpice with the schematic for easy reference.
Code:
.title one transistor oscillator
.MODEL BC337 NPN(IS = 4.887E-14 NF = 1.002 ISE = 2.552E-15 NE = 1.65 BF = 207.2 IKF = 0.902
+ VAF = 184.8 NR = 1.002 ISC = 7.006E-14 NC = 1.25 BR = 21.85 IKR = 0.1 VAR = 20 RB = 50 IRB = 0.0002
+ RBM = 2 RE = 0.119 RC = 0.25 XTB = 0 EG = 1.11 XTI = 3 CJE = 4.217E-11 VJE = 0.6596 MJE = 0.3434
+ TF = 6E-10 XTF = 2.1 VTF = 2.4 ITF = 0.79 PTF = 86 CJC = 1.734E-11 VJC = 0.1419 MJC = 0.3484
+ XCJC = 0.455 TR = 3.5E-08 CJS = 0 VJS = 0.75 MJS = 0.333 FC = 0.652)
*
K1 L1 L2 1
Q1 out N003 0 BC337
L1 N002 out 40U
L2 N001 0 1U
C1 N002 out 1N
V1 N002 0 10
R1 out N003 220K
C2 N001 N003 100P

.control
tran 5n 20u
.endc
.end
At this point I am comparing LTSpice with ngspice. Using the command "plot L2#branch" gives the attached graph. What is happening? Is this an ngspice bug? The graph implies there is a very high frequency acting on the base. I am also attaching a snapshot of LTSpice with the schematic for easy reference.
Attachments

Last edited:
I reduced the time increment to 100p. Now, both LTSpice and ngspice are in agreement. The first graph above is an artifact caused by an insufficiently small time increment.
I am trying to get an FFT for the output V(out) using the fft built in command. The .cir code is posted below.
I am only getting the following:
Consulting the user manual I found the following commands but without success. I want to get an FFT graph.
Code:
.title Large Amplifier with 2SA1943 & 2SC5200
*
.param freq = 1000
*
.include custom_components.bjt

V1 in 0 SINE( 0 1000m 1000 )
Q8 N029 N035 N040 2SC5200
Q11 N020 N007 N012 2SA1943
R16 N012 Vpos 0.22R
R17 N040 Vneg 0.22R
Q10 N029 N035 N041 2SC5200
Q12 N020 N007 N013 2SA1943
R18 Vpos N013 0.22R
R19 Vneg N041 0.22R
R20 N007 Vpos 22R
R22 N035 Vneg 22R
R21 N020 N003 0.1R
R24 N029 N003 0.1R
Q14 N035 N037 N029 MJE15033C
Q3 N029 N035 N042 2SC5200
Q15 N020 N007 N014 2SA1943
R25 Vpos N014 0.22R
R26 Vneg N042 0.22R
Q16 N029 N035 N043 2SC5200
Q19 N020 N007 N015 2SA1943
R32 Vpos N015 0.22R
R36 Vneg N043 0.22R
L2 N003 out 2U
R11 N003 out 5R6
C9 N003 N030 68N
R40 0 N030 6R
R41 0 out 8R
Q13 N007 N018 N020 MJE15032C
R1 N039 N045 47R
Q4 VBE+ N017 N010 2SA1406
R7 N010 N005 47R
Q5 N023 A N027 BC337-40
Q6 N024 B N028 BC337-40
R10 B N002 180R
C3 N002 0 2200U
R12 A N036 10K
C4 A N026 10U
Q1 VBE- N032 N039 2SC3600
Q7 N016 N016 N009 BC327-40
Q9 N017 N016 N008 BC327-40
Q18 N016 N019 N024 MPSA44
Q20 N017 N019 N023 MPSA44
R2 N005 N019 10K
R13 in N026 1K
R23 N036 N026 47K
C5 N026 N036 2.2N
C1 VBE+ N017 100P
Q17 N033 N032 N038 MJE340
R6 0 N032 10K
R8 N045 N038 270R
R27 N027 N033 12R
R29 N028 N033 12R
R5 N003 B 10K
R9 N005 N008 20R
R30 N005 N009 20R
C2 VBE+ VBE- 4.7U
D4 VBE+ N021 1N4148
D8 N034 VBE- 1N4148
Q21 N021 N022 N003 BC337-25
Q22 N034 N031 N003 BC327-25
D7 N003 N022 1N4148
D9 N031 N003 1N4148
R3 N003 N022 820R
R4 N003 N031 820R
R33 N020 N022 2.2K
R34 N029 N031 2.2K
D13 N001 0 1N4148
D14 N002 N001 1N4148
D15 0 N004 1N4148
D16 N004 N002 1N4148
R43 N018 VBE+ 22R
R44 N037 VBE- 22R
R47 N005 N006 100R
C7 0 N005 100U
D1 N032 N044 1N4148
D2 N044 N045 1N4148
D5 Vpos N006 1N4004C
C13 0 N006 100N
C15 0 N006 100U
R46 N045 N046 100R
C8 0 N045 100U
D6 N046 Vneg 1N4004C
C14 0 N046 100N
C16 0 N046 100U
R14 0 N036 10R
V2 0 Vneg PULSE( 72 82 0 1m 9m 0s 10m )
V3 Vpos 0 PULSE( 72 82 0 1m 9m 0s 10m )
Q23 N017 N011 N005 BC807-40
R15 N005 N011 1.5K
R45 N010 N011 2K
R31 0 N019 2.2K
C12 0 N019 33U
Q2 VBE+ N025 VBE- BD139
R28 VBE- N025 505R
R35 VBE+ N025 465

.control
 tran 100n 10m
.endc

.end
I am only getting the following:
Code:
ngspice 5 -> fft v(out)
FFT: Time span: 0.01 s, input length: 100001, zero padding: 31071
FFT: Frequency resolution: 100 Hz, output length: 65537
Consulting the user manual I found the following commands but without success. I want to get an FFT graph.
Code:
ngspice 8 -> setplot tran1
ngspice 9 -> linearize V(2)
ngspice 9 -> set specwindow=blackman
ngspice 10 -> fft V(2)
ngspice 11 -> plot mag(V(2))The format of NGspice looks weird to me .. not like a scripting language. It must be intended for embedding in usable programs.
Maybe you can find some help on stackexchange like the following example.
https://electronics.stackexchange.com/questions/587484/ngspice-combine-plots
Maybe you can find some help on stackexchange like the following example.
https://electronics.stackexchange.com/questions/587484/ngspice-combine-plots
For a listing of the first 9 harmonics and the THD percentage one can use the command:
Where freq is a number denoting the testing frequency and out is the output. Freq must first be simulated using the tran command.
To get a plot of the fourier transform graph the following sequence of commands can be used.
The following is what I got:
Code:
fourier freq outTo get a plot of the fourier transform graph the following sequence of commands can be used.
Code:
set xbrushwidth=2
fft out
plot db(out) ylimit -100 50 ylabel 'FFT'
The following is what I got:
Code:
ngspice 10 -> fourier 1000 v(output)
Fourier analysis for v(output):
  No. Harmonics: 10, THD: 0.0055851 %, Gridsize: 200, Interpolation Degree: 1

Harmonic Frequency   Magnitude   Phase       Norm. Mag   Norm. Phase
-------- ---------   ---------   -----       ---------   -----------
 0       0           -0.025753   0           0           0
 1       1000        10.0826     -0.75454    1           0
 2       2000        3.03893e-05 -29.636     3.01404e-06 -28.882
 3       3000        0.000445032 -166.25     4.41386e-05 -165.49
 4       4000        0.000111045 -83.095     1.10135e-05 -82.341
 5       5000        0.000215846 -151.09     2.14078e-05 -150.34
 6       6000        0.000109183 -85.462     1.08288e-05 -84.708
 7       7000        0.000145391 -133.69     1.442e-05   -132.94
 8       8000        0.000106359 -85.663     1.05487e-05 -84.908
9 9000 0.000121813 -119.76 1.20815e-05 -119- Home
- Design & Build
- Software Tools
- Trying to learn ngspice