I went back and used a micrometer to try and get more accurate numbers off the 300B plate curves on page 3, bottom (Vp = 250V).
Since the gm curves on page 5, top, indicate linear gm law occurring at around -58V (grid1)(Vp = 250V), that would indicate the Ip power law should be 2.0 there. So I took some extra data points on the plate curves (page 5) around -58V. So now:
Vg1 mA (at Vp = 250V)
-70 1
-65 4.5
-60 13
-59 14.5
-57.5 19
-57 20.5
-55 28
-50 52
-45 80.5
-40 112
-35 150
-30 190
Using the Vg1 = -60V to -55V interval where n should be around 2.0:
We try out some Vcutoff voltages with the Ip'/Ip = (Vg1'/Vg1)^n formula:
With Vcut = -71V we get:
11 13
16 28 28/13 = 2.1538, 16/11 = 1.4545455, so n = 2.05, pretty good
Then try the smaller Vg1 = -59V to -57V interval:
with Vcut = -71V we get:
12 14.5
14 20.5 20.5/14.5 = 1.4138, 14/12 = 1.1666667, so n = 2.24,
a little off, so maybe my new closer in measurements are not that good. Or the accuracy needs to be much better for small intervals.
try Vcut = -70V we get:
11 14.5
13 20.5 20.5/14.5 = 1.4138, 13/11 = 1.1818182, so n = 2.07, pretty good
Yesterday, the Vcutoff formula using (-60V 13mA,-55V 28mA,-50V 52mA) gave Vcutoff = -74.444 V
Lets try the Vcut formula with the new closer data now. We need equal spaced Vg1 intervals. (-59V 14.5, -57V 20.5, -55V 28):
Vcutoff = [ V2*I1*(I3-I2) - V1*I2*(I2-I1) ] / [ I1*(I3-I2) - I2*(I2-I1) ]
[(-57 *14.5*(28-20.5)) - (-59*20.5*(20.5-14.5)]/[14.5*(28-20.5) - 20.5*(20.5-14.5)]
or
[(-57 *14.5*(7.5)) - (-59*20.5*(6)]/[14.5*(7.5) - 20.5*(6)] = -1058.25/14.25 = -74.26 V
well, about the same as before
Now lets try the direct
1/n = I2/(I3-I2) - I1/(I2-I1)
formula with the new closer data (-59V 14.5mA, -57V 20.5mA, -55V 28mA):
1/n = 20.5/(28-20.5) -14.5/(20.5-14.5) = 0.31666
or n = 3.16
Yesterday we got n = 3.333 using the 1/n = .... formula with the -60V -55V -50V interval.
using the derived Vcutoff = -74.444 V in the Ip'/Ip = (Vg1'/Vg1)^n formula for the -60V -55V interval gave n = 2.581 yesterday.
and using the new derived Vcutoff = -74.26 V in the Ip'/Ip = (Vg1'/Vg1)^n formula for the smaller interval -59V -57V gives n = 2.81 now. Looks like closer intervals are worse for accuracy. Supposed to be 2.0. I was hoping that a closer interval would minize the affect of a varying n in the data on the formulas, but I guess data accuracy errors go up faster with smaller intervals.
and trying out the "coincidence" observation:
2.581 * (2.581/3.333) = 1.99866
2.81 * (2.81/3.16) = 2.4987
So I guess it was just a coincidence I found yesterday. Or it shows that closer intervals need more accurate data when differences are used in the formulas.
Well, that's about as good as it gets for trying to scrounge accurate data off datasheets, so I think it's time to put together a for real gm analyzer.
Last edited:
Woops, found a small error in the Vg1 mA table above for the 300B at 250 V.
the
-65 4.5 line should be
-65 4
and the -70 1 line should be -70 1.5
These didn't get used in any calculations anyway. So the complete 300B data table reads:
Vg1 mA (at Vp = 250V)
-70 1.5
-65 4
-60 13
-59 14.5
-57.5 19
-57 20.5
-55 28
-50 52
-45 80.5
-40 112
-35 150
-30 190
the
-65 4.5 line should be
-65 4
and the -70 1 line should be -70 1.5
These didn't get used in any calculations anyway. So the complete 300B data table reads:
Vg1 mA (at Vp = 250V)
-70 1.5
-65 4
-60 13
-59 14.5
-57.5 19
-57 20.5
-55 28
-50 52
-45 80.5
-40 112
-35 150
-30 190
Last edited:
I just came up with a new super approach to calculating the power law from tube plate curves. It works with just 3 plate current data points, is immune to n variation through the data, and does not require Vcutoff (the -Vg1 where the plate current goes to zero). Since it is immune to n variation through the data, one can space the 3 data points out to get better numerical accuracy from graph data.
How it works:
Assume you have some data that varies consistently with some "n" power law equation. If you apply 1/n roots to all the data, it will revert to a linear ramp. Now for 3 points equally horizontally spaced on a linear ramp, the (vertical axis) difference between points 1 and 2 must equal the difference between points 2 and 3.
So, starting from the original data:
I3^1/n - I2^1/n = I2^1/n - I1^1/n
or I3^1/n + I1^1/n = 2*I2^1/n
So you plug Ip3,Ip2,Ip1 in for 3 equally Vg spaced Ip data-points and solve iteratively for n.
Unfortunately, this is a bit of work manually, but easy to do with something like Mathcad.
To do it manually, just form two columns of I3^1/n +I1^1/n
and 2 * I2^1/n and solve using a likely "n" across each row, check to see if the two numbers are close. Then adjust "n" a little and make another row. Continue to iterate until the numbers come out real close. Final "n" is your answer.
It turns out that it gives a final "n" number very close to the previous formula 1/n = I2/(I3-I2) - I1/(I2-I1) which is easy to solve, so use that "n" for the 1st guess of "n" in the iteration method. Saves a lot of time.
Why would you want to use this harder method? Well it is solving for "n" at the central point, Ip2, which will give better accuracy since points 1 and 2 are equally spaced around it. (I think the 1/n method is solving for n halfway between the 1st and 2nd points, but it uses averages between the 1,2 and 3 point sets, so maybe it's centered on point 2) And this new technique is immune to consistent "n" variation across the data. That allows the data-points to be spread out more for better numerical resolution from the graph data....the biggest advantage.
To see this, revert back to the linear ramp of data n-roots picture. For constant "n" the ramp is a straight line. For "n" varying uniformly across the data, you get a slight S curve, with the higher "n" part curving upward, and the lower "n" part curving downward. But to 1st order, that leaves the vertical differences still equal between the points 1 and 2 and the points 2 and 3 if the curvature inflection is centered on the data point 2. (which it is, when "n" is correct. )
With the immunity to "n" variation, one can spread the data-points out further to get better numerical resolution off the graphs. There are no differential like differences used with this method, unlike the 1/n = ... technique.
However, after using this new method on the 300B plate data (using the Ip data table in the above post), I get very similar "n" values as the 1/n = .... formula approach gives. So I am suspecting that the 300B data-sheet is not using the same tube for the gm graph on page 5 and the Ip graph on page3. Or else there is some significant error in the graphs.
The two solution methods are quite different approaches, and for them to give nearly the same solutions, which do not agree well with the 300B gm graphs, tells me the problem is NOT in the formulas.........
So I'm going to try this on some other tube curves to see what I get. I just found 6HB6 and 12GN7 GE datasheets do give gm graphs as well as the continuous form Ip graphs. So I'm off to see the Wizard......
Last edited:
That's my suspicion as well, it would be great if someone can curve trace the 300B, plot out the gm curves, to see if they are even close to the one shown in the WE datasheet.So I am suspecting that the 300B data-sheet is not using the same tube for the gm graph on page 5 and the Ip graph on page3. Or else there is some significant error in the graphs.
Success! Finally
Using the 12GN7 GE datasheet, page4, bottom, I get n = 2.0 at -2.4 Vg1 (+175Vg2, +250 Vp)
and that agrees with the gm curve on page 5, bottom, where the gm curve straightens out in the S.
http://frank.pocnet.net/sheets/135/1/12GN7A.pdf
Vg1 mA (Vg2 +175V, Vp +250V) 12GN7A
-3.0 12
-2.8 17
-2.75 17.75
-2.5 25.2
-2.4 27.5
-2.375 29.5
-2.25 33.75
-2.0 44
-1.75 54
-1.5 65.2
-1.25 77
-1.0 89.5
This was using the new Ip3^1/n + Ip1^1/n = 2 * Ip2^1/n formula.
The 1/n = I2/(I3-I2) - I1/(I2-I1) formula agrees fairly closely too. So I use it for the 1st guess for n in iterating the new formula.
Found a quick way to iterate the new formula too.
Just compute [ (Ip3^1/n + Ip1^1/n) /2]^n and compare that with Ip2
Using a column for the left side of the equation to write the results versus n, compare those with Ip2, and iterate n (slightly adjust, like by +/- 0.1) to get an exact match. (start from the 1/n = equation as a 1st guess for n).
Can put 1/n in the calculator memory, and the whole left equation side can be calculated in one pass on the calculator without using any extra memory. Quick.
If the left side comes out too small for matching Ip2, then decrease n slightly or visa versa.
I need to automate the whole thing in Mathcad next. Then plot the power law n versus Vg1 and then can derive the gm curve from that easily too.
So this IS working if one has a good data-sheet to start from.
Of course, if you just want a gm curve, then just calculate delta Ip / delta Vg everywhere to make a gm graph versus Vg1.
I wanted a numerical "n" power law method for comparing tube linearity. I'll have to make a chart of "n" at half or one third max plate curve current range for all the tubes for an apples to apples comparison.
Last edited:
That's great! Could you please do a quick recap? So an exponent of 2 at the desired operating point should have the best linearity, right?
Well, the n = 2.0 gives a linear ramping gm versus Vg1 in the local region. That bodes well for linearity in class A, P-P, where the opposing gm ramps of the two tubes add up to a constant gm. However, strictly speaking, one would want to do the test along an actual load line (as seen by a tube) rather than a vertical path. I have to try that yet, but it should work. I3 is always the higher Ip point, and I1 the lowest Ip point in any of the formulas. Points are equal Vg voltage steps apart.
Testing the "n" calculation along a vertical line was mainly to test the plate curves versus the gm curves on the datasheets, since that's what they (unfortunately rarely) give. It also gives one a standard method for an apples to apples comparison between different tubes, if one sets some criteria for what plate current level to test at. Since a typical load line is going to be passing through something like 1/4 to 1/3 max datasheet plate curves current, at half the max plate voltage shown, something like that is what I would choose for doing consistent comparisons of different tubes (for crudely ranking linearity).
For real performance analysis, one will then want the gm data analyzed along the actual load line, and then summed with the complementary tube (class A, P-P).
For SE applications, it's not real clear how useful this analysis is. One would like n = 1.0 for that case for constant gm. Nothing around like that, but I guess one could try for 1.5 at least. SE depends heavily on triode feedback to fix things up.
I guess if one were going to try one of those "anti-triode" schemes (P-P class A emulating SE), there could be some utility. But the typical "anti-triode" P-P scheme actually wants constant gm for the emulating "anti" tube side. Would be an interesting test though to look at total gm in that case. Maybe small variation of a large gm on the "anti" side just nulls out the larger gm variation of a small gm on the triode driver side. Don't know. Interesting question really. One could gm analyze a Mosfet as well. I think one still ends up with a SE triode signature there due to the triode feedback controlling everything. The large gm on the "anti" side is mainly used to just freeze the cathode "tail" voltage. But maybe something interesting happens sound wise when the two sides gm variations are canceling. I'll have to think about that one. Could be like making the triode operate at constant current, (where gm stays constant), even though its not.
Last edited:
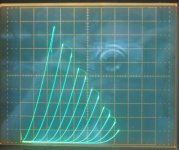
Try this one, it's not curve traced but made from the GE datasheet...sorry to butt in, but any of you guys did triode curves for 21HB5?
An externally hosted image should be here but it was not working when we last tested it.
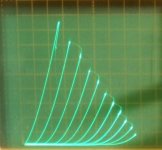
Here is the GE 21HB5A on the curve tracer. 7 V grid 1 steps, 50 mA/div Vertical, 50 V/div Horizontal.
Jazbo8, how do you make triode curves from the datasheet? Some kind of curve fitting program?
Jazbo8, how do you make triode curves from the datasheet? Some kind of curve fitting program?
Attachments
Last edited:
I used a three step process - first I added the Ia and Ig2 current from the datasheet together to make a crude triode characteristic chart, then I use it with a curve fitting program to make the SPICE model, which then can be used to re-generate the triode curves with the desired range and grid voltage spacing. It's not perfect, but the result in this case, matches up to your curves pretty well - close enough for rock & roll as they say.😀Jazbo8, how do you make triode curves from the datasheet? Some kind of curve fitting program?
question for smoking-amp, how would you rank this tubes in the hierarchy of the other tv tubes? these tubes look like tv scanning tubes without the screens...
found these gems at a shop that sopped selling tubes a long long time ago in the environs of manila..
found these gems at a shop that sopped selling tubes a long long time ago in the environs of manila..
An externally hosted image should be here but it was not working when we last tested it.
An externally hosted image should be here but it was not working when we last tested it.
Here is a datasheet, hard to read.
http://frank.pocnet.net/sheets/084/5/50C-A10.pdf
Seem to have typical triode curves (amount of rollover typical, probably optimised for gm with that 14000 uM at 80 mA, Rp 620) 30 Watt, 200 mA max DC, Mu 8 but dropping with higher voltage
http://frank.pocnet.net/sheets/084/5/50C-A10.pdf
Seem to have typical triode curves (amount of rollover typical, probably optimised for gm with that 14000 uM at 80 mA, Rp 620) 30 Watt, 200 mA max DC, Mu 8 but dropping with higher voltage
found these gems at a shop that sopped selling tubes a long long time ago in the environs of manila.
Quite a find. I bet they would be worth a small fortune in Japan.
jeff
The big cooler fins on the grid would make one think they could do class A2 or AB2. The datasheet says 0V max on the grid though. I guess that's how they get 30 Watt Pdiss with a plate size equivalent to 18 to 24 Watt TV sweeps.
The 50C-A10 has specs somewhat similar to a 21HB5A (in triode), except Mu 4.8 then (actually, more like 5.2 at 80 mA). (230 mA max DC, gm 12450 @ 80 mA, Rp 385)
6HB5 triode curves attached for comparison.
The 50C-A10 has specs somewhat similar to a 21HB5A (in triode), except Mu 4.8 then (actually, more like 5.2 at 80 mA). (230 mA max DC, gm 12450 @ 80 mA, Rp 385)
6HB5 triode curves attached for comparison.
Attachments
Last edited:
Here is a datasheet, hard to read.
http://frank.pocnet.net/sheets/084/5/50C-A10.pdf
Seem to have typical triode curves (amount of rollover typical, probably optimised for gm with that 14000 uM at 80 mA, Rp 620) 30 Watt, 200 mA max DC, Mu 8 but dropping with higher voltage
yes i have seen the data sheets, looks like 300 volts plate, but i am more incline towards 350 volts...with tubes, it seems voltage is cheap and current expensive...
i hope Miles can come up with a load-line plot....
You hit the jackpot, bro! These are damn expensive tubes very sought after by the Luxman owners, perhaps it would be better to sell them and get a truckload of other TV tubes in return.😉found these gems at a shop that sopped selling tubes a long long time ago in the environs of manila..
You hit the jackpot, bro! These are damn expensive tubes very sought after by the Luxman owners, perhaps it would be better to sell them and get a truckload of other TV tubes in return.😉
yes, i am selling them, but i am also giving the option to build them a tube power amp using these tubes....
i am selling them for 2000 pesos a pop, i see the shuguang versions go for 4500 pesos, and mine are original copies....
- Home
- Amplifiers
- Tubes / Valves
- Those Magnificent Television Tubes