ndepot,
Yes, about the same 1KHz performance as the wire (opc:s measurement). Not bad for a 30 year old design. Sub 0.1% at 300W 100kHz is impressive (I think).
I will soon build a soundcard interface. With current soundcard in loopback 3:rd harmonic dominates at -100dB so it will hardly be sufficient (measuring 3:rd) for this kind of amp. However rest of the harmonics is down at -110db, noise at -120dB so maybe I'll see someting. 🙂
I hope we will se a lot of measurements, it’s quite revealing.
The LME supply is +/- 65V from HP regulated power supplies. Owen's board has additional capacitors for isolation and noise filtering.
The transformer >1KVA
Smoothing caps are 72,000 uF for each rail, plus 1000 uF more per rail on the board.
I believe that we can rule out the transformer.
The transformer >1KVA
Smoothing caps are 72,000 uF for each rail, plus 1000 uF more per rail on the board.
I believe that we can rule out the transformer.
Hi,AndrewT,
Here is clipping at 3% THDN.
Neel
frequency of the input signal?
Last edited:
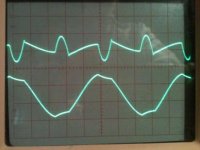
I have no idea why the clipping looks like that... I've never seen that before, and my measurements here don't reflect that.
I'll test in a few minutes and report back.
It almost looks like the power supply begins to collapse at the peak and doesn't recover until the load is lightened.
I think AndrewT might be on to something asking about the supply and the transformer, but npdot's setup seems pretty hefty.
I'll post measurements in a little bit with the DPS-600
Cheers,
Owen
Andrew,
Just brainstorming:
1. Output device transconductance droop due to current surge
2. Output device transconductance droop due to rapid changes in die temperature.
3. ??
Just brainstorming:
1. Output device transconductance droop due to current surge
2. Output device transconductance droop due to rapid changes in die temperature.
3. ??
please, change f of input signal 10x high and show clip.
if you change f eg. low (150hz) and (clip angle) moves to counter-clockwise, then is a problem on psu
if you change f eg. low (150hz) and (clip angle) moves to counter-clockwise, then is a problem on psu
Last edited:
npdot,
It may be out of scope of this thread but my interface will be based on Pete Millet’s interface. His webpage is certainly worth a read: Soundcard Interface
There is a lot of threads about sound car interfaces but please let me know (by PM?) if there is something you want to know about my specific setup.
AP2,
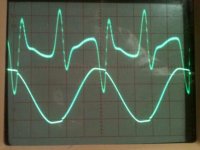
150Hz
the angle is now shifted counterclockwise.(as I thought)
I do not understand though, how is it possible to 150Hz, the output Vp is reduced to + /- 15V?
Last edited:
Hi Guys,
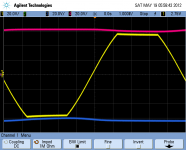
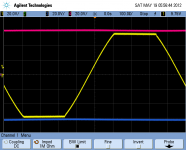
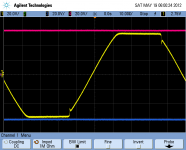
I performed these measurements in my setup here using an Agilent scope and The Wire connected to a DPS-600 supply.
The load is 8 ohms (WW resistive), and the rails are 65VDC on the mosfets (@400mA bias) and 80V on the LME.
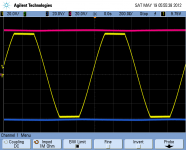
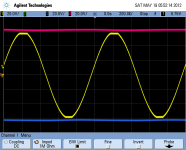
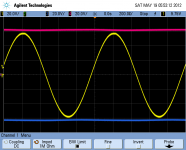
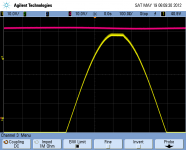
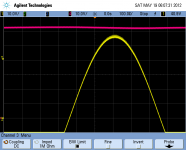
Let's start with the way the waveforms looks at increasing distortion levels:
1. 1kHz waveform at 0.005% THD+N
2. 1kHz waveform at 0.1% THD+N
3. 1kHz waveform at 0.5% THD+N
4. 1kHz waveform at 1.0% THD+N
5. 1kHz waveform at 10.0% THD+N
I performed these measurements in my setup here using an Agilent scope and The Wire connected to a DPS-600 supply.
The load is 8 ohms (WW resistive), and the rails are 65VDC on the mosfets (@400mA bias) and 80V on the LME.
Let's start with the way the waveforms looks at increasing distortion levels:
1. 1kHz waveform at 0.005% THD+N
2. 1kHz waveform at 0.1% THD+N
3. 1kHz waveform at 0.5% THD+N
4. 1kHz waveform at 1.0% THD+N
5. 1kHz waveform at 10.0% THD+N
Attachments


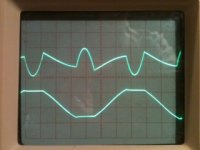
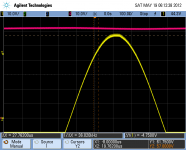
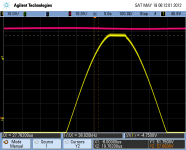
Next up we have zoomed in views of the previous captures. These were done on the positive rail only, and at 10V/div on the output and rail. Looks like I forgot to save the 10% one :S
1. 1kHz waveform at 0.005% THD+N
2. 1kHz waveform at 0.1% THD+N
3. 1kHz waveform at 0.5% THD+N
4. 1kHz waveform at 1.0% THD+N
5. 1kHz waveform at 0.1% THD+N with cursors showing 4.75V peak to rail delta
6. 1kHz waveform at 1.0% THD+N with cursors showing 4.75V peak to rail delta
1. 1kHz waveform at 0.005% THD+N
2. 1kHz waveform at 0.1% THD+N
3. 1kHz waveform at 0.5% THD+N
4. 1kHz waveform at 1.0% THD+N
5. 1kHz waveform at 0.1% THD+N with cursors showing 4.75V peak to rail delta
6. 1kHz waveform at 1.0% THD+N with cursors showing 4.75V peak to rail delta
Attachments
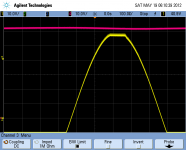

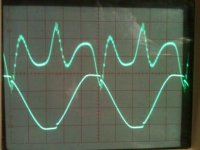
My favourite one is the 150Hz 10% measurement as it shows what I suspect is the issue that npdot is seeing with his setup.
Here's my theory for npdot's setup:
Even with a 1kVA toroid and lots of capacitance, the rails will sag significantly under full power load. I get the feeling the cap bank has enough energy stored to maintain rail voltage nearly up to the peak at 1kHz, then starts to pull the rail down as the caps struggle to recharge and maintain the rail voltage, hence the non-flat top of the clipped output wave.
This seems to be further emphasized by the much lower clipping level at 150Hz where the capacitor bank won't do much at all, and the transformer is providing all the power through the peak. The 10kHz waveforms seem to be clipping at much higher voltage levels, further confirming that the huge cap bank is maintaining the rail voltage for the much shorter duration peaks at 10kHz, and the output is actually clipping into a rail that remains relatively stable.
All we need to do to confirm this is to get npdot to put one channel of the scope on the positive supply rail right at the amplifier PCB, and the other channel of the scope on the output right at the amplifier's positive terminal.
This will show us exactly what the supply rail is doing in an instantaneous manner as the output clips.
If it sags down and matches the shape of the clipped waveform, it will be exactly what I suspected above.
It will also be a free advert why regulated supplies are best 🙂
Cheers,
Owen
you know when this problem was posted, that was my first cheeky thought, not a wimpy unregulated supply either. great shots to analyze the problem mate! you too npdot! whatever the causeIt will also be a free advert why regulated supplies are best
everyone can see this, but just to be clear
My favourite one is the 100Hz 10% measurement as it shows what I suspect is the issue that npdot is seeing with his setup.
not 150Hz, you must have had npdot's results on your mindThis seems to be further emphasized by the much lower clipping level at 100Hz where the capacitor bank won't do much at all
Last edited:
- Home
- Amplifiers
- Solid State
- "The Wire AMP" Class A/AB Power Amplifier based on the LME49830 with Lateral Mosfets