The full-bridge output stage design significantly reduces even-order distortion.Seems to be an odd order dominant harmonic profile.
Theoretically, both fixed-frequency and self-oscillating Class D modulation methods are not inherently distortion-free (as demonstrated in my earlier simulation results). Without applying PFFB, increasing the operating frequency is a crucial approach to reducing distortion.
Another takeaway from the measurement is that the LC filter, particularly the inductor, does not introduce significant distortion if it is well-designed.

After adjusting the circuit component values, the background noise (A weighted) has been reduced from the original 17 µV to 14.8 µV, with a noise density of approximately -135 dBV. The distortion has also been reduced to some extent. I believe there is still room for further optimization, and I am looking forward to it.
Attachments
Wow! THD 0.002% with a no-feedback design? remarkable! It outperforms the majority of top-tier Hi-Fi amplifiers.
Waiting for the module test results.
Waiting for the module test results.
The headphone amp's noise level has been reduced to just a few microvolts. However, the actual noise is likely even lower, as the audio analyzer's noise is around 2.5 µV. 🙂

What about noise skirts measured as described at: https://www.diyaudio.com/community/threads/phase-noise-in-ds-dacs.387862/#post-7063038
The skirts only appear at higher frequencies, but it's unclear whether they are caused by the DAC/ADC of the audio analyzer, or the amplifier.


You need a very high resolution FFT. Like maybe 4-million points, say, with maybe a 1kHz digital test signal. What does it look like plus or minus a few Hz from 1kHz, if expanded out and looking down near the noise floor? IOW, the skirts are part of one spectral line down near the noise floor. How wide is the base of one spectral line?
You should look at the FFT settings used in the examples at the link I posted above.
How about we just see what it looks like first, then if it doesn't look as good as you would like maybe we could figure out the contribution of each possible source? Otherwise how will you ever know how you are doing in that particular area of design quality? You might be able tell in listening tests, but first you would need a way to change the skirts enough to make the change audible. Then you can know what a change sounds like.
Last edited:
No feedback is a fools paradise.
You get tons of compression pumping or spend extra complexity on tightly regulated power supplies.
A TPA3255 with PFFB and a opa2134 preamp should perform far better below 500Hz. It should be at least twice as good on the top end as well.
You get tons of compression pumping or spend extra complexity on tightly regulated power supplies.
A TPA3255 with PFFB and a opa2134 preamp should perform far better below 500Hz. It should be at least twice as good on the top end as well.
Last edited:
Well, actually it kind of seems like there is sort of some feedback. It is to make the amplifier self-oscillate, but IIUC it does so in response to the output voltage as compared to the input voltage. IOW, its not what we usually think of as linear feedback.
Self oscillating feedback will make a huge difference as the switching frequency is the max the circuit gain will allow. The correction gain is far higher in the audio range.
Every design has its trade-offs, and the actual performance depends on the specific application and optimization. I'm happy to discuss the technical aspects.No feedback is a fools paradise.
Received 2rd version PCBA of Class-D amplifier module today.

The first board is brought up, the operation frequency is 3.78MHz, the idle power is about 19W.

The oscillation wave is shown below.

the background noise is 30uV (13dB), 50uV (26dB).

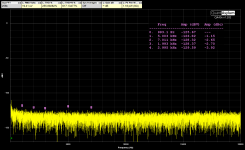
multitone test looks very good.

frequency respond is very flat.

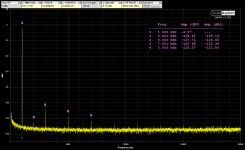
THD+N is about 0.0028% @ 3W 8Ohm.

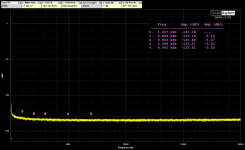
THD+N: 0.005% @6W 8Ohm

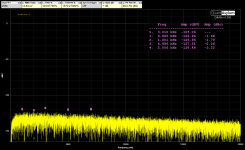
THD+N: 0.058% @37W 8Ohm

THD+N: 0.066% @93.7W 8Ohm

The oscillation wave is shown below.
the background noise is 30uV (13dB), 50uV (26dB).
multitone test looks very good.
frequency respond is very flat.
THD+N is about 0.0028% @ 3W 8Ohm.
THD+N: 0.005% @6W 8Ohm
THD+N: 0.058% @37W 8Ohm
THD+N: 0.066% @93.7W 8Ohm
FR could be shown with say 3 dB over whole y axis.
How about a really har one: quattro tone at say 40W
//
How about a really har one: quattro tone at say 40W
- 20Hz
- 600Hz
- 18k
- 19k
//
Last edited:
The first board is brought up, the operation frequency is 3.78MHz, the idle power is about 19W.
View attachment 1453042
The oscillation wave is shown below.
View attachment 1453043
the background noise is 30uV (13dB), 50uV (26dB).
View attachment 1453044
multitone test looks very good.
View attachment 1453045
frequency respond is very flat.
View attachment 1453046
THD+N is about 0.0028% @ 3W 8Ohm.
View attachment 1453047
THD+N: 0.005% @6W 8Ohm
View attachment 1453048
THD+N: 0.058% @37W 8Ohm
View attachment 1453049
THD+N: 0.066% @93.7W 8Ohm
View attachment 1453050
Do you know what causes the increased distortion at higher power levels?
I assume its from the power supply?
Maybe you could measure the ripple on the power at heavy load?
This is a preliminary test result. The test was conducted by measuring directly from the load. Generally, Class D amplifier testing should be performed through an additional anti-aliasing filter to further suppress out-of-band noise and effects, thereby reducing their mirror-image influence on the in-band signal. The power supply used for the test was a 600W switching power supply, which may have larger ripple compared to a typical linear power supply. If the transient response of the switching power supply is suboptimal, it can indeed increase harmonics during high-power output.
Overall, this test result should be considered the worst-case scenario. Objectively speaking, considering the absence of PFFB and front-end negative feedback like that used in the TPA3225, I am still quite satisfied with the result.
Subjectively, compared to the first version, there is a slight improvement in listening impressions. The overall sound is extremely clean, transparent, and the detail retrieval remains astonishing. The initial friction sound of the violin bow against the strings is particularly realistic, creating a very strong sense of presence. At the same time, this version shows a lower sense of speaker presence, possibly due to the use of higher-end coupling capacitors.
I will continue to fine-tune the circuit parameters. If I achieve better results or gain further insights, I will provide updates accordingly.
I didn't use any scripts yet.Nice to see the QA403 in action!
Are you using Bob Cordell's scripts?
They are not required, but can be a great time saver and guarantee repeatability.
https://www.cordellaudio.com/instrumentation/quantasylum.shtml
Jan
https://www.cordellaudio.com/instrumentation/quantasylum.shtml
Jan
- Home
- Amplifiers
- Class D
- The Journey of DIY No-Feedback Class D Amplifier (1) Subtitle: The Motivation and Story Behind It