Another, perhaps more compelling reason AES67 will not be deployed in home audio is it's lack of support for DRM (Digital Rights Management).
Howie
Is that a reason for the users or the perps?
Is that a reason for the users or the perps?
Well, the crafty users may indeed develop an open-source system for consumer AES67...but you know the answer for the perps Scott...he same breed of, um human who brought you MQA...if it don't come with a license it's crap!
Howie
Linkwitz used what he called "tonebursts" to measure speakers, they look a lot like wavelets to me (not sure if it's the same offhand, but the raised cosine envelope sure looks similar:
System Test
Something my buddy was advocating long before i put this up in Jan 2007. My buddy evangilized it/pitched it to Linkwitz.
Cosine Burst
Mostly there for me to be able to point people at it.
dave
Interesting reading JA’s comment to the effect that the Quads measured so idiosyncratically and yet sounded amazing.
(And no, I’m not an advocate of ‘there are some things we cannot measure in audio’)
(And no, I’m not an advocate of ‘there are some things we cannot measure in audio’)
Interesting reading JA’s comment to the effect that the Quads measured so idiosyncratically and yet sounded amazing.
)
A low distortion speaker has that affect. Tends to sound good anywhere. See Linkwitz on his preferred polar pattern speakers and why.
-RNM
Last edited:
Does anyone know anything about wavelets? (Yes, I've posted something like this before).
JAES papers
In private conversation, Robert Greene - PHD mathematics professor at UC LA - said he is the inventor of Wavelet concept. He is retired but you could find him and ask him.
He is on Facebook, I see.
THx-RNMarsh
Last edited:
Ps.. And no, scottjoplin, it wasn't about ITD...😀
Not distortion, frequency/time shifting of all the mini transients in and around the cymbal strike? Perhaps you have merely overlooked it 😉 Then again if both channels are the same it shouldn't be an issue, except maybe blurring/widening of the image?
A low distortion speaker has that affect. Tends to sound good anywhere. See Linkwitz on his preferred polar pattern speakers and why.
-RNM
Yes - and as far as I know, no cabinet resonances or sharp corners with degradation problems.
Yes - and as far as I know, no cabinet resonances or sharp corners with degradation problems.
There is the benefit of the figure of 8 polar pattern.... lower level of early side wall reflections. The JBL M2 also has lower side wall/early reflection but it is done via sound wave-guide to shape dispersion pattern.
THx-RNMarsh
Last edited:
Well, you make my point further. This is bad loudspeaker data from Stereophile. ONLY near field measurements (or anechoic) are supposed to be used to measure the speaker itself. No one is interested in someone else's room's affect on any loudspeaker being tested. And rooms are not all the same. It is useless info about the ESL its self, otherwise.
The ESL is quite flat as I also measured.
THx-RNMarsh
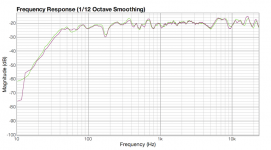
Measuring quite large panel speakers (to get something comparable to the frequency response of "normal" speakers) was always a challenge.
Measuring in the extreme nearfield will result in a curve with downward slope.
There was a reason why big panel speakers response was often given as a 1/3 octave graph instead of the usual one.
But AFAIR JA shows frequency response curve is the averaged result of a family of curves taken on different angles. Loudspeakers with higher directivity above 10 kHz will therefore always show less level in that region.
Edit:Atkinson described his method for measuring loudspeakers in an AES convention paper, but it is available in three parts on the stereophile website:
Measuring Loudspeakers, Part One | Stereophile.com (part 1)
Measuring Loudspeakers, Part Two | Stereophile.com (part 2)
Measuring Loudspeakers, Part Three | Stereophile.com (part 3)
Part 3 covering the frequency response
Last edited:
Yes of course, you can't take off part of the frequency content without changing the time domain content.The initial discussion was if cd rate was sufficient. Cymbals were introduced as an offending signal.
My statement is in essence...
3. If the primary signal is high enough in frequency, a modulating envelope may produce sidebands where the upper sideband will exceed the filter cutoff. If that occurs, the consequence will be that the envelope of the filter output will be changed from that of the original.
4. A high bandwidth signal such as a cymbal will have envelope modulated components we can hear, producing sidebands above and below primary, as well as ultrasonic components with both upper and lower content. Filtering the upper part out above Fs will still alter the final reproduced envelope.
What exactly is a Gibbs envelope, and where and how can you see that the decision to stop at 44k was not perfect ?My example of the sine modulated by a sine, or by an exponential, are the easy types. Unfortunately, an exponential does not have one frequency, nor is it time invariant. FFT analysis does not easily provide an instant by instant spectra, so cannot tell us what part of the waveform will be filtered, just what frequencies.
The Gibbs envelope does. It can show us when the product goes above Fs.
That is why I earlier stated that using the Gibbs envelope is the best way to spot when content is pulled.
And, looking at the Gibbs envelope with cymbals, it is clear the decision to stop at 44k was not perfect
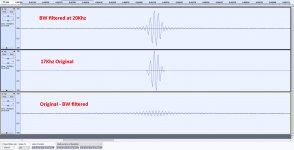
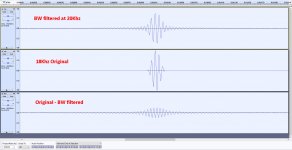
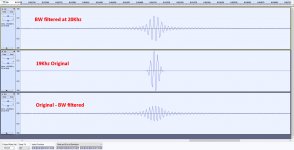
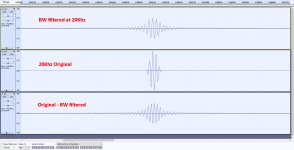
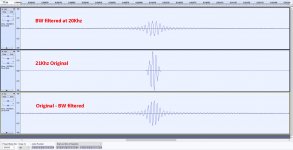
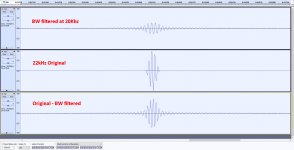
I have made another set of sims, this time by using a ratio of 5 between the raised cosine and sine to get the sidebands at a higher level as the factor 20 in my previous sim.
Since my Brick wall filter is at 20Khz, I have chosen for sine frequencies of resp 17Khz up to 22Khz, each 1Khz apart.
What you can see is that all content below 20Khz remains, including the sidebands.
The difference signal, being the removed part by filtering, shows the sum of the Gibbs exitation plus the content above the 20Khz Brick Wall filter.
I don't see anything where I could even suspect that the sub 20Khz signal is crippled in any way, apart from the Gibbs additions, in this case at 20Khz, but for a 44,1 CD at 22,05Khz, beyond our hearing limit and thus completely harmless.
Hans
Thanks a lot,Measuring quite large panel speakers (to get something comparable to the frequency response of "normal" speakers) was always a challenge.
Part 3 covering the Stereophile frequency response
this clarifies things.
Hans
AES67
This may sadly be true. I'll off and research.
Well, the crafty users may indeed develop an open-source system for consumer AES67...but you know the answer for the perps Scott...he same breed of, um human who brought you MQA...if it don't come with a license it's crap!
Howie
This may sadly be true. I'll off and research.
Han's,
Your 20 kHz plots are a perfect example. Look at the before and after plot. The filtered 20khz has a different frequency. If you overlay orig and filtered, you will see the frequency shift very clearly.
This is the exact same phase walking effect that occurs when two sines beat.
And yes, I used the term Gibbs envelope to describe the form of the Gibbs. Another new term is phase walking..the effect which occurs when a sine is added to a another of different frequency. I demonstrated this earlier, showing that the frequency within each lobe for two sines added was the average frequency but that it flipped sign each lobe. IIRC, it was 17.5 added to 22.5, and I overlayed 20khz to show that exact effect.
So, the envelope modulation of a below Fs signal has two sidebands. If one sideband goes above Fs, the filter will remove that, and as you are demonstrating, the resultant output will have a different frequency content as well as a different envelope. If you were to run with continuous modulation, you will see that subsequent lobes will flip phase, and that an FFT will not show the within lobe frequency, but only the two sidebands.
For my exponential envelope modulation, it should demonstrate a time varying frequency shift. That is why I chose it. It's all about metrics, the ability to measure.
In addition, you have demonstrated that the lower frequency output also has a wider envelope.
These are significant differences, and are caused by having frequency content so close to Fs.
Jn
Last edited:
But AFAIR JA shows frequency response curve is the averaged result of a family of curves taken on different angles. Loudspeakers with higher directivity above 10 kHz will therefore always show less level in that region.
e
An averaged response over a wide angle of measurements is a power response. I agree if dispersion becomes more narrow as freq increases, a power response will show that as a rolled off high end.
Power response more closely correlates with far field listening. Mastering, recording/mix down is mostly near field listening. Speakers known as Near Field Monitors are for this use. Near field requires flat on-axis response.
JA, at the end near his conclusion states.... " As I wrote in 1991 [80], "The best-sounding loudspeakers, in my opinion, combine a flat on-axis midrange and treble with an absence of resonant colorations,...."
So, If the Stereophile data is to be useful to readers, it needs to always include on-axis near field response (anechoic-like). A curve of the speakers directivity index (DI) or its power response is a good addition for estimating far field listening.
Speakers such as the JBL M2 attempts to have both -- flat on-axis and flat power response.
The non-consumer speaker world uses DI or Directivity index.
Ideal vs Real Loudspeaker Directivity
THx-RNMarsh
Last edited:
Last edited:
Isn't that exactly what was envisaged in the first place ?Han's,
So, the envelope modulation of a below Fs signal has two sidebands. If one sideband goes above Fs, the filter will remove that, and as you are demonstrating, the resultant output will have a different frequency content as well as a different envelope.
I still don't get where you are heading to.
There are technical things one can describe and measure, but in this very case we are looking at Audio signals that may or may not be crippled by filtering the signal above our hearing limit.
That a seemingly frequency shift takes place has everything to do with the subtraction of the "above Brick Wall" and the addition of the Gibbs frequency, both being above our hearing limit, that's it, I see no further magic.
No It doesn't.If you were to run with continuous modulation, you will see that subsequent lobes will flip phase, and that an FFT will not show the within lobe frequency, but only the two sidebands.
See both spectra below, in this case a continuous signal composed of a 20Khz sine modulated by a 4K raised cosine, before and after 20Khz brick wall filtered.
Hans

Isn't that exactly what was envisaged in the first place ?
I still don't get where you are heading to.
There are technical things one can describe and measure, but in this very case we are looking at Audio signals that may or may not be crippled by filtering the signal above our hearing limit.
That a seemingly frequency shift takes place has everything to do with the subtraction of the "above Brick Wall" and the addition of the Gibbs frequency, both being above our hearing limit, that's it, I see no further magic.
No It doesn't.
See both spectra below, in this case a continuous signal composed of a 20Khz sine modulated by a 4K raised cosine, before and after 20Khz brick wall filtered.
Hans
View attachment 818521
It's not "seeming", it is frequency shift. Overlay the before and after filter and examine the zero crossings.
As I said, the FFT does not see the resultant frequency of the output. You have demonstrated exactly what I said.
There is the benefit of the figure of 8 polar pattern.... lower level of early side wall reflections. The JBL M2 also has lower side wall/early reflection but it is done via sound wave-guide to shape dispersion pattern.
THx-RNMarsh
I know this is not even close to what’s being discussed, but the lower level of room reflection comment made me think of this exact opposite which seemingly also has a figure 8 polar pattern that can be placed one in front and one behind listener? These were popular in your heyday, any experience with them?
HUMAN Speakers: EPI 1000 information
- Home
- Member Areas
- The Lounge
- The Black Hole......
