The winner here is the large bevel, the 2-3k range is by far best served by it. Nice work- also, this thread should be stickied.
It would be interesting to see what the diffraction responses would be like with tweeter offset somewhat on the baffle.
C.M
C.M
Thank you for taking the time to do this and for sharing your results. This is great information.
Definitely the 4th profile with the 30 degree bevels is producing superior results. It's the only one that doesn't have that severe on-axis dip between 2.4K and 3.2K. I wonder how shallow the bevel can be and maintain similar results?
Definitely the 4th profile with the 30 degree bevels is producing superior results. It's the only one that doesn't have that severe on-axis dip between 2.4K and 3.2K. I wonder how shallow the bevel can be and maintain similar results?
Awesome job Dave!
Can you share the drawing of the jig you used for the 4th/large bevel baffle? I want to try it for my next build.
Many thanks for your effort.
Can you share the drawing of the jig you used for the 4th/large bevel baffle? I want to try it for my next build.
Many thanks for your effort.
Could somebody just walk me through what I am supposed to see in the plots.
BTW, best practice in research these days is to state what you expect to look at ahead of time and to consider any other result as just notable and worthy of further study. Second best is to demonstrate that the bump at X Hz is closely equal to a quarter wave-length or something at Y inches. Not just "see that bump" or "see that dip".
Nice to see this careful testing. Thanks. But I'd been happier to see round panels. That would maximize the diffraction effects at a single freq........ if any. From that benchmark, various interventions could be tried.
I wonder if Earl regrets posting that bit text quoted above. Ordinarily, looking at plots (hearing with your eyes) is a whole lot more alarming than the sound of this or that little bump or valley. The opposite of what Earl says. In the context of his original post, I think his meaning was more like, "golly, just some times....."
B.
Last edited:
I wouldn't want to go quoting Earl in some silly pre-morning coffee remark but this one I'm inclined to consider. And understand that all I'm suggesting here is perspective so as to get to the heart of the issue. Eg: People move their tweeter around the baffle until the response looks smooth but the diffraction is still delayed. How do we know that a smooth response here isn't a coincidence as you say, Ben, one baffle feature might maximise the appearance of some effect. Just like you said, what is being looked at here?
@ DaveFred
bolserst may be the expert in these waters but I'm curious. Could you present some data in the form of excess group delay?
bolserst may be the expert in these waters but I'm curious. Could you present some data in the form of excess group delay?
Nice to see this careful testing. Thanks. But I'd been happier to see round panels. That would maximize the diffraction effects at a single freq........ if any. From that benchmark, various interventions could be tried.
On the other hand, part of what these approaches do is distributing diffracted frequencies- so if the goal is to minimize diffraction audibility, you'd want to not only reduce Q of resonances but distribute midpoint frequencies more broadly.
With respect to audibility of what's on a graph, it goes both ways. Small effects can seem huge, huge effects can seem small. For instance, relatively minor visual inconsistencies in the pattern in the 2-5kHz range can really futz with localization cues, but a single high-Q spike at 10kHz might not even be audible most of the time.
This is the direction I would go too, for a general diffraction expose on a conventional speaker, except that it is beyond the scope of OP enclosure intentions and limitations.Nice to see this careful testing. Thanks. But I'd been happier to see round panels. That would maximize the diffraction effects at a single freq........ if any. From that benchmark, various interventions could be tried.
This is a very nice experimental dataset. Renormalizing the curves so that they match properly at low frequency would help the interpretation.
One comment I would make is that the zeroth-order effect of diffraction is determined by baffle frontal area (meaning these 4 baffles are virtually the same in terms of the broad transition from full space to half space). The changes to edge geometry are giving rise to smaller first-order variations in the same broad transition.
Now, if one doubled the baffle area, then a zeroth-order difference would occur -- something that should be audible because of the significantly different in-room average spectral density. But in this case the spectral density should be the same (i.e., SPL averaged over all solid angles) and the differences subtle.
Anyhow, the relative audibility of these subtle, first-order irregularities is one question, but the "listener" preference for one over the other (assuming the same "average" tuning) is a more complicated and deeper question.
This is a very nice experimental dataset. Renormalizing the curves so that they match properly at low frequency would help the interpretation....
What interpretation? Can't somebody just walk us through these curves and point to exactly what they are supposed to be revealing?
B.
Last edited:
Take a look at the on-axis plot of all 4 baffles together (the first plot in post #14): The SPL matches from 10k up, the region where the tweeter would be isolated from any baffle effects. I conclude that the recording levels are properly matched between the various baffles. Therefore, the small SPL differences in the low frequency range (below 1.5k) are NOT a recording anomaly, but are actual differences in baffle effect.
Last edited:

Yes, the plots in #14 are fine, whereas those in #15 need normalization.Take a look at the on-axis plot of all 4 baffles together (the first plot in post #14): The SPL matches from 10k up, the region where the tweeter would be isolated from any baffle effects. I conclude that the recording levels are properly matched between the various baffles. Therefore, the small SPL differences in the low frequency range (below 1.5k) are NOT a recording anomaly, but are actual differences in baffle effect.
My opinion is that his data-collection practices are already research quality. The dataset and rationale are excellent. Maybe I should have been more clear about that.It is not reasonable to expect DaveFred to follow research "best practices" because he is not being paid to do this research.
This is a very nice experimental dataset. Renormalizing the curves so that they match properly at low frequency would help the interpretation.
One comment I would make is that the zeroth-order effect of diffraction is determined by baffle frontal area (meaning these 4 baffles are virtually the same in terms of the broad transition from full space to half space). The changes to edge geometry are giving rise to smaller first-order variations in the same broad transition.
Now, if one doubled the baffle area, then a zeroth-order difference would occur -- something that should be audible because of the significantly different in-room average spectral density. But in this case the spectral density should be the same (i.e., SPL averaged over all solid angles) and the differences subtle.
Anyhow, the relative audibility of these subtle, first-order irregularities is one question, but the "listener" preference for one over the other (assuming the same "average" tuning) is a more complicated and deeper question.
I noticed this same problem - frontal flat area of cabs 3 and 4 are remarkably different from 1 and 2, which none the less are exactly equal.
Normalization or level matching at 1kHz might make some comparisons easier, but I''m OK with these done at same distance, same voltage (obviously).
Good point. The projected area is the same, but the surface area is not. FYI I just read your post #11 and agree. More good points.I noticed this same problem - frontal flat area of cabs 3 and 4 are remarkably different from 1 and 2, which none the less are exactly equal.
Normalization or level matching at 1kHz might make some comparisons easier, but I''m OK with these done at same distance, same voltage (obviously).
Thanks to DaveFred for this excellent and precise work! Very helpful, especially the two different ways you layered the results.
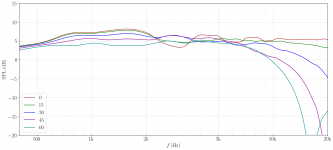
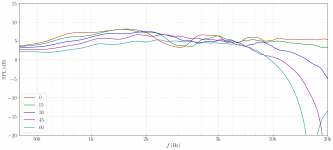
Here are simulated diffraction gain curves (for the control baffle with sharp edges) in both the vertical and horizontal directions (normalized to 0dB at 10Hz). Note that these curves flatten out quickly everywhere off the tweeter axis, with the implication that the power response is essentially the same for all baffle shapes. In the plots, I've tried to keep the same aspect ratio, axis increments and line colors as for the measured data. I just made a guess for the tweeter location and enclosure depth, so if I get more precise baffle data I can regenerate these curves.
BTW, these results indicate that DaveFred's polar plots were actually normalized properly in the first place, so my apologies for the earlier comment about that.
It would be very interesting to see the measured vertical polar curves, as well as the infinite-baffle measurements. With the infinite baffle data we could extract the diffraction gain.
NOTE: images order is horizontal then vertical
Attachments
Last edited:
- Home
- Loudspeakers
- Multi-Way
- Testing baffle edge treatments for tweeter diffraction.