Time to spend some quality time with this soundcard.
The idea is to improve its suitability for audio measurements.
A quick summary :
Pros --
- USB so can be located on the bench instead of hauling the PC around
- 192k with proper bandwidth
- Nice ADC chip
- Balanced Inputs
- Jitter is rather low
- Headphone output has strong drive current
- "low noise" (cough, cough) preamps.
Cons --
- Sounds like crap, although that doesn't change the measurement results
- Huge amount of HF noise in headphone output
- Temperamental driver and crappy software
- Windows only
- Very territorial concerning which USB port it wants to work with (due to drawing too much current)
- AC coupled of course
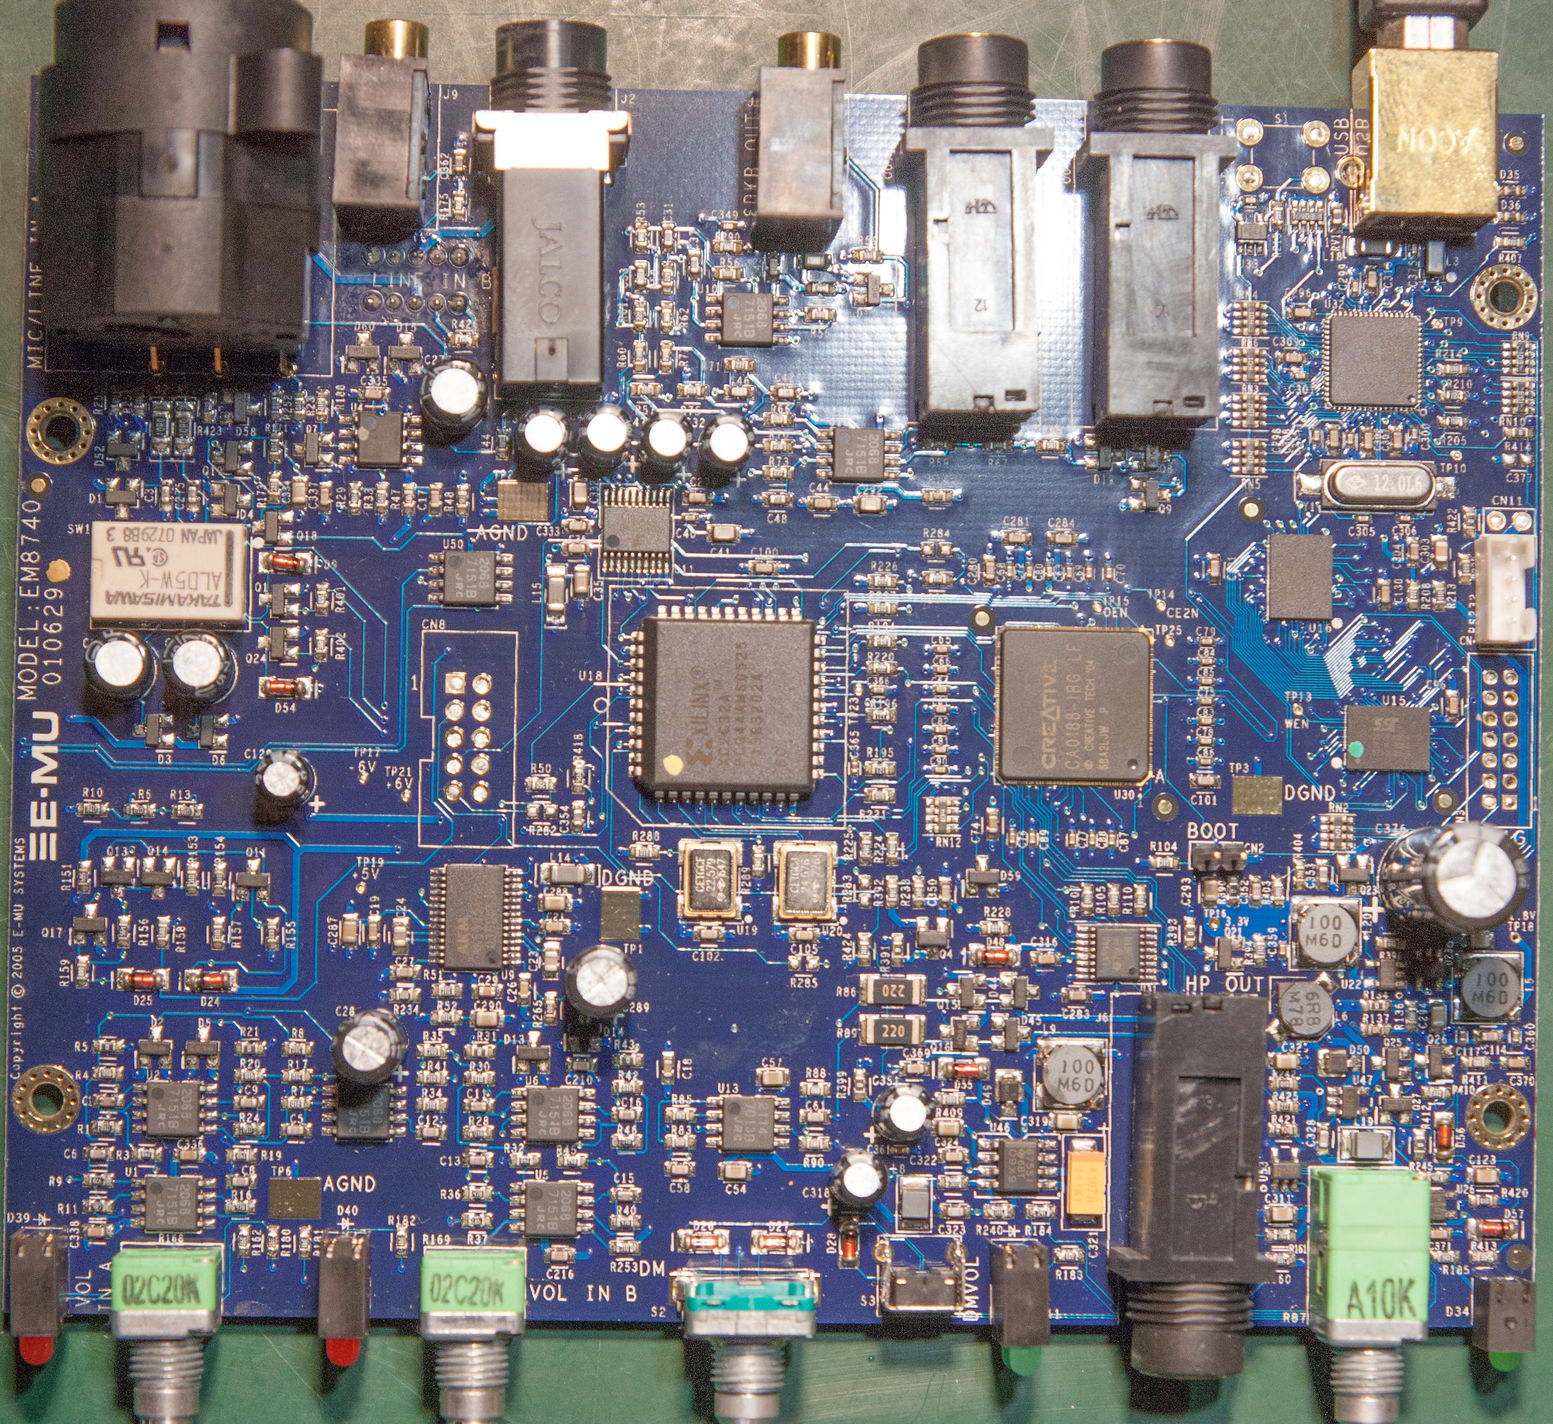
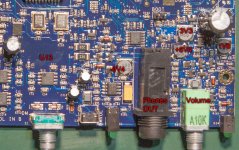
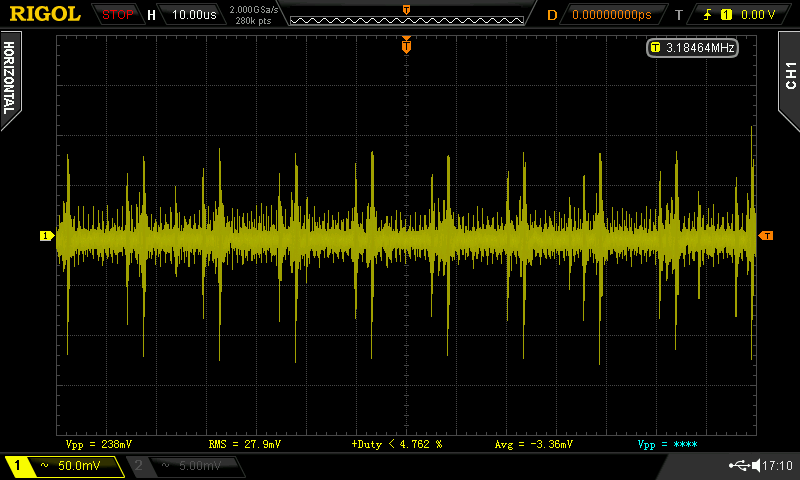
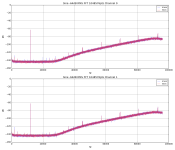
Okay, let's go. Output waveform, not playing any audio. 50R coax soldered to bottom of board.
Hm. A bit noisy. Could it have anything to do with the fact there are 4 switching regulators right next to the volume pot and the output jack ?...

The power distribution is a bit complicated.
USB VBUS runs through the switch in the volume pot (thereby rubbing a little bit more noise from VBUS on top of the noise from the switchers...) then to the large electrolytic cap. It then powers 4 switchers for:
+1V8 (main CPU with "CREATIVE" written on top)
+3V3 (everything else)
+6V4 and -6V4 for opamps
Why such a weird voltage? My guess would be that the thing draws 450mA on VBUS already, so they went with what they could...
The DAC's +5V comes from a LDO fed from +6V4. This LDO is of course not right next to the DAC but in the bottom right corner along with another +3V3 LDO (no idea what for but it isnt the clock) and various switching transistors.
The idea is to improve its suitability for audio measurements.
A quick summary :
Pros --
- USB so can be located on the bench instead of hauling the PC around
- 192k with proper bandwidth
- Nice ADC chip
- Balanced Inputs
- Jitter is rather low
- Headphone output has strong drive current
- "low noise" (cough, cough) preamps.
Cons --
- Sounds like crap, although that doesn't change the measurement results
- Huge amount of HF noise in headphone output
- Temperamental driver and crappy software
- Windows only
- Very territorial concerning which USB port it wants to work with (due to drawing too much current)
- AC coupled of course
Okay, let's go. Output waveform, not playing any audio. 50R coax soldered to bottom of board.
Hm. A bit noisy. Could it have anything to do with the fact there are 4 switching regulators right next to the volume pot and the output jack ?...
The power distribution is a bit complicated.
USB VBUS runs through the switch in the volume pot (thereby rubbing a little bit more noise from VBUS on top of the noise from the switchers...) then to the large electrolytic cap. It then powers 4 switchers for:
+1V8 (main CPU with "CREATIVE" written on top)
+3V3 (everything else)
+6V4 and -6V4 for opamps
Why such a weird voltage? My guess would be that the thing draws 450mA on VBUS already, so they went with what they could...
The DAC's +5V comes from a LDO fed from +6V4. This LDO is of course not right next to the DAC but in the bottom right corner along with another +3V3 LDO (no idea what for but it isnt the clock) and various switching transistors.
Attachments
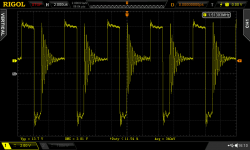
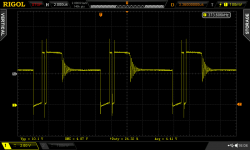
Well, well, the +6V4 switcher works in discontinuous mode of course, which means the voltage on its switching node looks like... this...
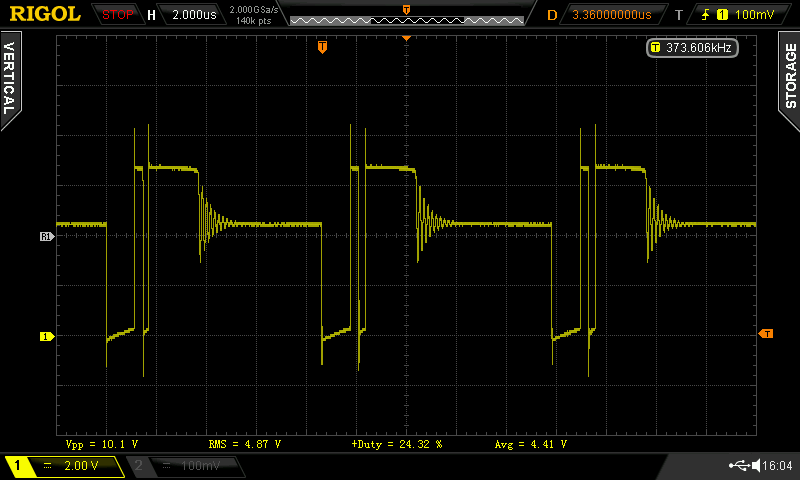
And its buddy the -6V4 inverting converter looks just as bad.
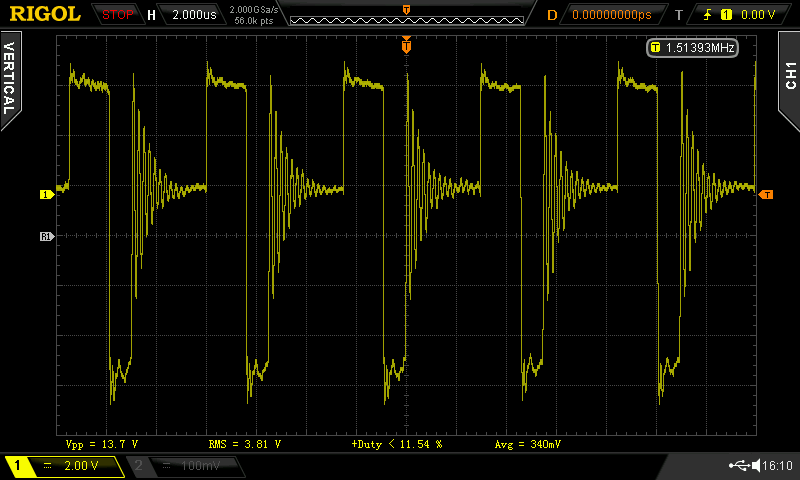
The other two run at 1 MHz, thank you very much, and the 1V8 one has no capacitor on its output. There are plenty of caps around the main CPU, of course, but they're quite far away. This means the 1MHz pulses which manage to jump across the inductor's parasitic capacitance wreck a trail of destruction across the ground plane. Everything on this board is sprinkled with 1MHz noise...
Let's have a look at opamp U13's positive rail...
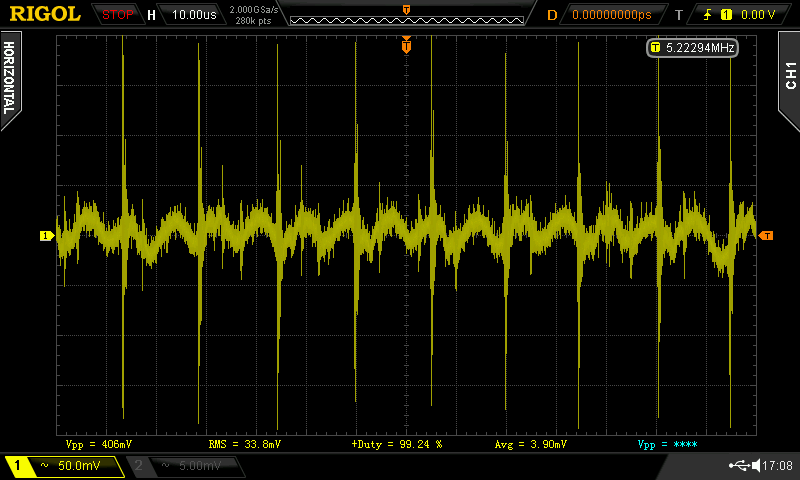
...and its negative rail...
Yikes. The peak to peak values are particularly insulting. This is taken direct across the opamp decoupling capacitor... and obviously, with that kind of spikes on a capacitor, it means some current spikes are involved, too, which makes the ground very noisy. I'll start with taking out the switchers and replacing them with a bunch of LM317's powered by a small transformer... This will also allow me to use this soundcard with the laptop!
The line outputs on the rear are less noisy.... well, still noisy, but a bit less.
To Be Continued !
And its buddy the -6V4 inverting converter looks just as bad.
The other two run at 1 MHz, thank you very much, and the 1V8 one has no capacitor on its output. There are plenty of caps around the main CPU, of course, but they're quite far away. This means the 1MHz pulses which manage to jump across the inductor's parasitic capacitance wreck a trail of destruction across the ground plane. Everything on this board is sprinkled with 1MHz noise...
Let's have a look at opamp U13's positive rail...
...and its negative rail...
Yikes. The peak to peak values are particularly insulting. This is taken direct across the opamp decoupling capacitor... and obviously, with that kind of spikes on a capacitor, it means some current spikes are involved, too, which makes the ground very noisy. I'll start with taking out the switchers and replacing them with a bunch of LM317's powered by a small transformer... This will also allow me to use this soundcard with the laptop!
The line outputs on the rear are less noisy.... well, still noisy, but a bit less.
To Be Continued !
Attachments

Last edited:
I have done the following modifications:
- Removed all switchers, and replaced by LM317/337 regulators, using proper output caps, etc. The soundcard is now a lot less user-friendly, since it needs an extra +/- 10V PSU. But as audiophile things go, the more impractical the better, right ?
- Added caps on board (in parallel with existing caps) to meet LM317/337 stability requirements.
- Improved filtering on DAC +FILT pin by adding a capacitor.
- Replaced 47µF DC blocking caps with 470µF. This extends the low-end... I don't mean the BASS, I mean the ability to use the soundcard as a low-frequenyc signal generator without too much attenuation...
- TODO: mill a hole in the top cover to let the heatsink through
Results:
High frequency spikes in the output are competely gone. It is clean now... yeah, well, as clean as CS4392 output can be, which is a mess of sigma-delta modulator noise (a 10kHz full scale sine showe visible wobbliness)... but at least it no longers look like the output of a DC-DC converter !
Playing 192k silence. Lots of modulator noise still. Fix would be to use a real DAC chip, aint gonna do that.
Naaah, really, it's OK, the heat sink doesn't protrude too much from the case, noone will notice anyway.
Attachments
Last edited:
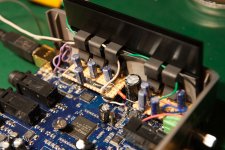
Now, most certainly the performance of this soundcard must have reached stellar new levels !
Before : red
After : blue
Nope. Absolutely identical. Except the cap on DAC reference voltage which lowered the spikes which were already at -120.
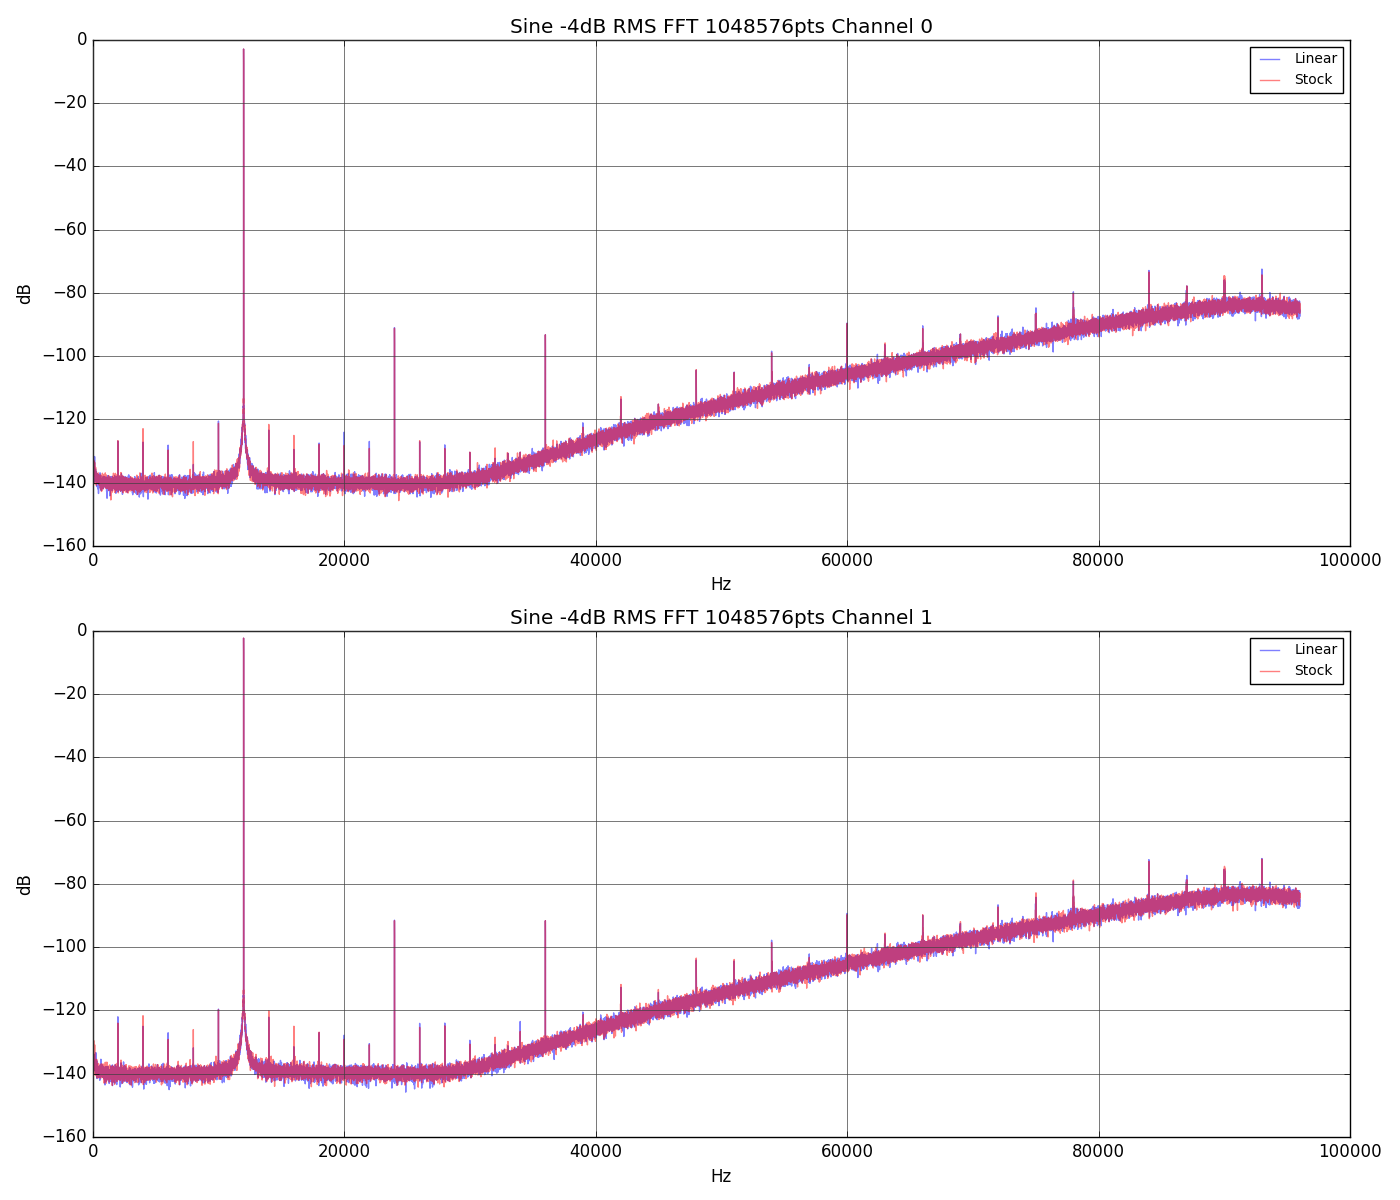
Maybe on a lower level signal?
Nope. No change at all.
Now, there are two ways to interpret this :
1) 0.5Vpp of DC-DC converter spikes in the output is perfectly fine! It all measures and sounds the same anyway.
2) FFT of a sine wave tells the whole story about harmonic distortion, but nothing at all on aperiodic signals, noise, etc, since the very purpose of FFT is to observe periodic signals by averaging out everything else! If the opamps went into random slew rate lockup due to the spikes, it probably wouldn't even show up.
Before : red
After : blue
Nope. Absolutely identical. Except the cap on DAC reference voltage which lowered the spikes which were already at -120.
Maybe on a lower level signal?
Nope. No change at all.
Now, there are two ways to interpret this :
1) 0.5Vpp of DC-DC converter spikes in the output is perfectly fine! It all measures and sounds the same anyway.
2) FFT of a sine wave tells the whole story about harmonic distortion, but nothing at all on aperiodic signals, noise, etc, since the very purpose of FFT is to observe periodic signals by averaging out everything else! If the opamps went into random slew rate lockup due to the spikes, it probably wouldn't even show up.
Attachments
How about a noise modulation test?
Headphone output pushes 20Hz +/- 2.5vpk into 150R, which gives +/- 16mA. I should have used a smaller resistor for more current. Theory was that this current would modulate the DC-DC noise, and this would somehow show up on the output.
A python script looks over 8 seconds (therefore 160 periods) of signal. A highpass filter is applied to get rid of the 20Hz sine. Then, each sample which is at the same time offset in different periods should have the same value.
Signal is the mean of these points.
Noise is the standard deviation.
Plot explanation :
X axis is output voltage (thus current) scaled to -1 .. 1
Y axis is amount of noise (arbitrary units, in dB).
Top plot : Noise on 20Hz sine.
Bottom : Noise on other channel, which is shorted.
Interestingly, some noise modulation happens, although the change in regulators doesn't do anything at all to it!
Attachments
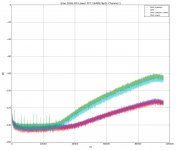
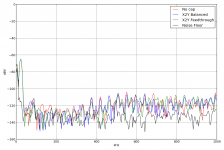
Investigating the noise floor again. This time a 1Mpts FFT is done.
Test signal is 10Hz.
Green, Cyan : straight from output to input.
Red, Blue : a 2 kHz RC lowpass filter is added into the loop.
We can see high frequency noise floor drops like a stone (25dB gain) due to filtering. This means the simple RC filter got rid of most of the noise, and this in turns means it came from the DAC. The ADC's high frequency noise floor is much lower, even when processing a full-scale signal.
This is very good.
Now, turning the volume pot down (Green/Blue=full, Cyan/red=lower) causes very little change in the ADC noise floor. This may mean the ADC's noise modulation could be much lower than the DAC's. More investigation is needed...
Attachments
I'm gonna do a few more tests tomorrow to characterize the ADC noise floor (I need to know if it depends on level), then build a small PSU with a transformer and it'll be done.
I'm satisfied that the linear regulators cleaned up the HF hash in the output... for the crummy DAC chip, though, nothing can be done really, besides using another soundcard. This one will do
I think my PC is too old for this... especially the laptop. Thanks for mentioning it, though.
I'm satisfied that the linear regulators cleaned up the HF hash in the output... for the crummy DAC chip, though, nothing can be done really, besides using another soundcard. This one will do
USB driver that makes the USB port a high current charging port and the PC then supplies more current to it.
I think my PC is too old for this... especially the laptop. Thanks for mentioning it, though.
It's funny how standard audio measurements don't correlate with subjective listening... or even non-audio measurements. The typical onboard sound today measures better than electronics of yesterday, yet the motherboards from the Core2Duo era onwards always give me an unexplainable headache and an unmeasurable subjective boost in bass. Figuring out the missing link would be worth an audiophile's version of Nobel prize.
Yeah, there's science to be done
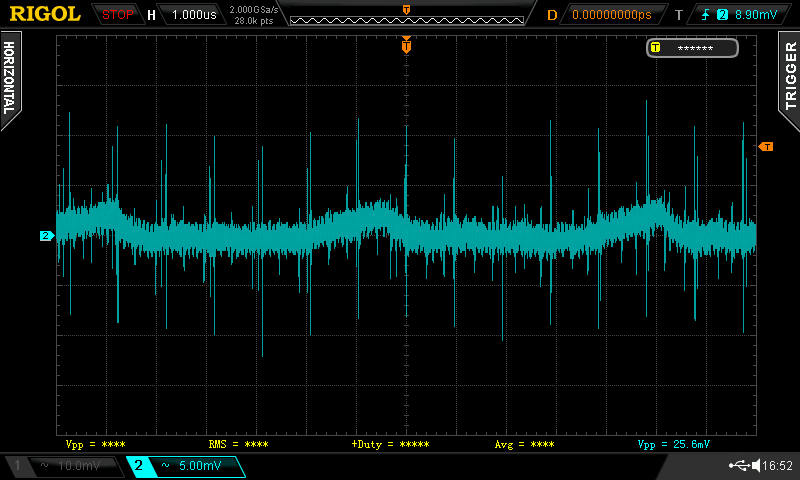
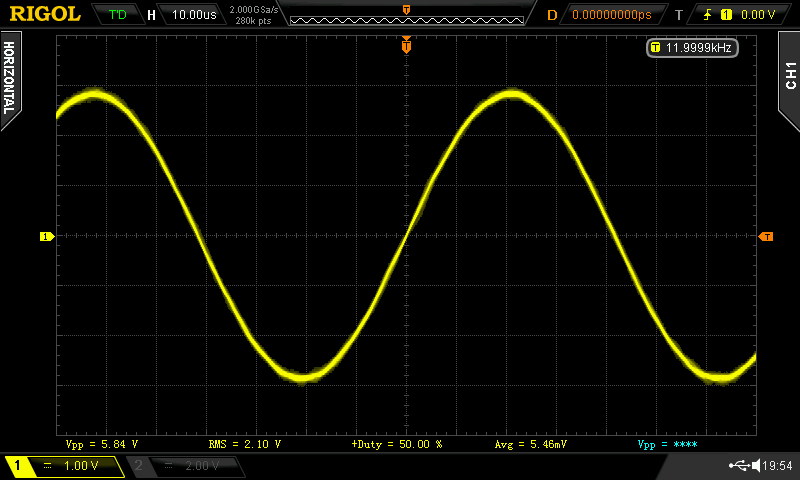
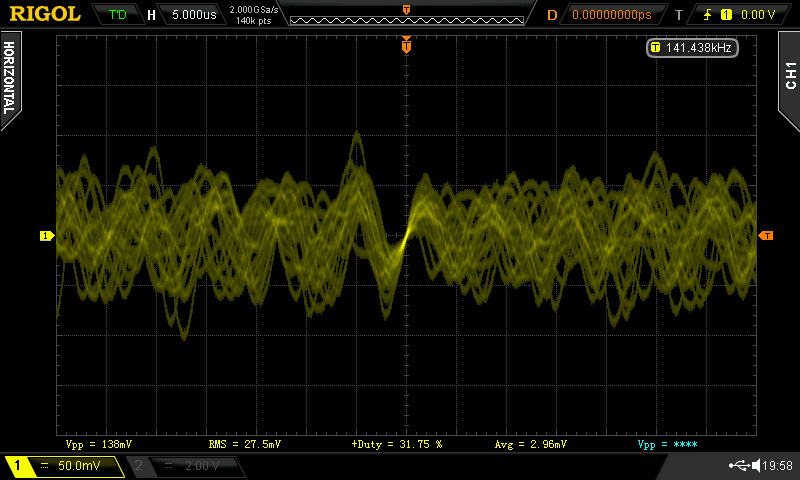
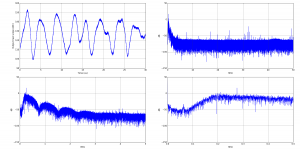
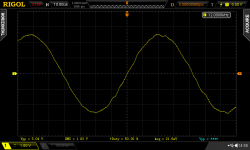
Now, here's a shot of the modulator noise at the output. This is a waveform acquired using Rigol DS2000 scope, which has a bug: if I try to save a long waveform in .CSV, it crashes. Therefore, I saved it in proprietary ".WFM" format, which no program can read. Huh? No problem. The raw data is at the end of the file, in the form of 8-bit samples, easy enough to exploit. Of course, any information about voltage, range etc is lost but who cares, I only wanted to show the signal shape and its spectrum.
The amusing thing is that it does look almost periodic... but it is not. It looks more like bandpass filtered noise (which is exactly what it is). Its amplitude relative to output signal is... quite respectable, enough to make a 10kHz sine wobble on screen (see scope shot).
A lower-cutoff lowpass at the output would hide this noise of course. I wonder how many bits the DAC modulator has...
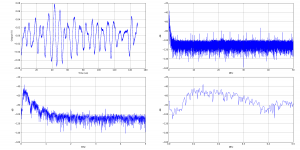
Attachments
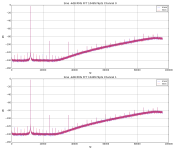
Now, let's make a little bit of a comparison. Both graphs are correctly scaled (in dBV).
Pic #1 is output of E-MU 0202, which plays silence. Pay attention to the lower right curve.
Pic #2 is output of ES9018, filtered by a simple capacitor. It plays a low-amplitude 22kHz sine (visible as a peak at the left). This is an old measurement, but I believe the scales to be correct. ES9018 has a little less output aplitude, so it cheats a little here, by a few dB.
Anyway, it's easy to see ES9018 pushes modulator noise much better and much further out of the audio band... It's about 60-70dB better at these frequencies. That's more than 1000x better!
Of course, ES9018 has only a capacitor on the output, while CS4392 has the full output filter.
No wonder one sounds good, and the other sounds like crap.
Point to note : Measurement of how well a sigma delta modulator pushes its noise up in frequency might hint at how it sounds. I'll remember this for later.
Attachments
Last edited:
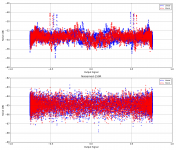
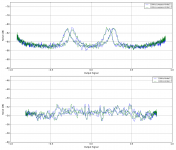
Another noise modulation test, this plot is unusual, so I will explain...
A 100 Hz signal is played back and recorded at 192k, during about 20 seconds. This means we have 20k periods.
By aligning each period (ie, each block of 1920 samples), for each point at the same offset in period, we get one measurement per period. They should all be identical, since they are at the same point inside the period.
- Average is signal
- Standard deviation is noise
This maps to :
X-axis is signal amplitude.
Y-axis is noise amplitude.
Top curve has a lowpass filter applied, which removes most of the DAC noise. Bottom curve does not.
Green has the output volume pot turned down a few dB (about -6dB). Blue is full amplitude.
So basically, any wiggle in the curves means noise amplitude depends on signal amplitude.
How I interpret this (and I'm listening to your ideas)...
1) Bottom graph: this is mostly DAC noise, since lowpass filter is not applied. Green curve, which has the volume pot turned down, looks like a scaled down copy of blue curve.
DAC noise thus wobbles about 3dB around depending on signal amplitude being played. Rather ugly, especially the "W" shaped wiggles on both sides of zero.
2) Top graph: lowpass filter is applied, so we measure ADC noise plus whatever is left of DAC noise. Green (lower volume) shows a lowering of the noise floor. Therefore some DAC noise is still there. However the two wide peaks around +/- 0.25 amplitude do not move: they are modulations in the ADC's own noise.
Point to note: Both ADC and DAC modulate their noise floor according to signal value, so when using this soundcard for noise measurements, I should always make damn sure that, IF there is some signal present, then the noise to be measured should be many times higher than the ADC's own noise. Like, 10-20 dB higher. Can't trust the damn thing and say "Oh it adds in RMS fashion, just RMS-substract and its fine" when the noise floor moves around all over the place
Attachments
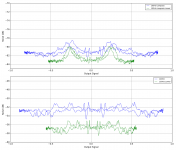
I overcame sunday afternoon laziness and added a 2nd-order lowpass filter on the output with a corner frequency of about 800Hz. This should remove most of the DAC noise.
Top graph is filtered.
Top graph is NOT lowpass-filtered. Straight DAC to ADC.
So, the second-order RC filter pushes DAC noise below ADC noise, and we can see the ADC modulating its own noise by about 6dB, depending on input signal level.
Point to note: Any noise measurement using this soundcard should really be performed 10dB above its own noise floor, as a safety margin.
Okay, maybe it's crosstalk or something. I disconnect the unfiltered channel : no change. By the way, each plot includes 2 curves, each using half the data in the recording. Since they are identical, we can be sure we're not measuring gremlins.
Maybe it's some 50Hz from mains since I used 100Hz... hmmm, I try a 128Hz test signal: still identical measurement. It's the ADC.
Attachments
Last edited:
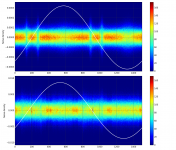
Hehe, this is fun.
How to represent noise? How about a 2D-histogram. White sine wave is actual voltage. Histogram in background is the statistical distribution of noise at each point in the sine. Vertical axis is noise amplitude, and color represents the probability of noise having this amplitude.
It tells more than the standard deviation, which basically only says "Noise power is X..."
Top is ADC noise (using lowpass filter to get rid of DAC noise as previously). Bottom is DAC, which is too much of a mess to be useful. I will focus on ADC.
Interesting thing is that, while at most points on the sine, the noise amplitude seems to follow a nice, zero-centered distribution, at some amplitudes, it changes. This is very visible in the graph.
I will try to plot these as curves instead of color map... Should be interesting.
Attachments
This is fascinating but a little abstruse for most here (including me). Help me understand and learn how to duplicate the measurements.
First the noise modulation on the sine wave output from the DAC. I believe you are indicating that its significant on a cycle by cycle basis. If I were to record a long sequence of sine waves and then look at individual cycles I would see these variations? And they are in effect noise modulating the sine (ignoring possible sources). And they don't show on a typical FFT but a statistical analysis of the amplitude density would show them? I can also capture with a USB scope with deep memory but only 10 bits resolution. Is that enough to see these issues? Could I notch out the fundamental and then see the modulation?
Second, similar for ADC performance? I'm a little confused by your ADC noise plot. What is the difference between the three curves? Different ADC's have different noise shaping. The AK5385 has the noise floor rising at about 30 KHz. The AK5394 doesn't start rising until more like 80 KHz. Does the frequency of the noise distribution relate to its amplitude distribution?
I'm really interested and want to follow (and if its not too complex, duplicate some of) your measurements.
Well, I had trouble sleeping, so here I am!
Yes. A sigma delta modulator generates lots of noise, shaping its spectrum to push most of it out of the audio band where it can be filtered out in the analog domain. Some modulators are better than others at this. More bits, higher modulator sample rate, and a better design, all help. Please don't ask about the details, I have no idea about how to design a S-D modulator... but they do have strange quirks... in fact these things are like deep physics, maybe ten people in the world really know how they work!
Now, I read in some ESS and Wolfson docs that the amount of noise depends on the current sample value being played. Their method was to plot noise versus DC offset. I wanted to replicate this, but my soundcard is AC-coupled.
Please check out this article.
According to ESS (page 3) it's a whole entire can of worms.
We could model it with :
output = input + Fnoise(input)
with Fnoise being random noise whose amplitude depends on the input value (and perhaps its slew rate or recent history too according to Dustin!)...
Nope
Consider a white noise signal n(t). Its spectrum will be flat.
Now, pick your favorite signal s(t), say a square wave which has values 0 or 1. Or pulses... or anything.
Multiply the two : output(t) = s(t) * n(t)
You get gated noise. When s(t)=1, there is noise. When s(t)=0, no noise.
Multiplication in time is circular convolution in frequency domain. Therefore,
spectrum(output) = spectrum (convolved by) spectrum(s)
...and your noise spectrum is flat. If you convolve a flat line with anything... you get another flat line. Whatever the spectrum of s(t) was, the FFT won't show it. All you get on screen is a noise floor...
See this post where I manufacture completely different signals which all have visually identical FFT.
Yes.
First way would be to output a slowly varying digital ramp to the DAC. Start at the most negative value, and increment slowly... Ac-couple it to get rid of the slowly rising DC voltage, and measure the RMS noise value. Either using analog circuitry, or a suitable amplifier followed by an ADC and software.
This would be the best way, as if you find a DC offset that makes the modulator misbehave, like output a short burst of oscillation, it'll be very visible.
Or you could script it to measure DNR on a -60dB sine with varying DC offsets... there are many ways.
You'd get sompething like Figure 6 in the above document... or maybe Figure 7. Quite a big difference in behaviour between the two!
I used a low frequency sine because it was simple and worked in AC-coupled mode (my soundcard is not DC coupled).
Imagine watching a scope screen. Every period of the sine is drawn in the same place, but noise thickens the trace. I do the exact same thing in software. It outputs a sine, records it, then stacks each period on top of all the others. Each sample at the same offset in each period should have the same value. The difference between them is noise at this specific offset into the period.
That could work but IMO it is much simpler to do it with the soundcard as both playback and capture are synchronized, so many periods can be accumulated.
Same thing... they're sigma delta too...
OK.
Post #14 shows RMS noise power (Y) depending on signal amplitude (X). Top is ADC, bottom is DAC.
Around ADC amplitudes +/- 0.25, noise increases.
Post #15 shows the same data, with different presentation. The sine shows where we are in the signla being played. The colorful background is a 2D histogram of the noise. The amplitude of each noise sample is on the y axis, and now many samples have this noise value is represented by the color.
Keeping in with the scope trace analogy, this is like seeing the signal on a scope : noise thickens the trace... but here, by substracting the signal, I make the trace flat, so I can zoom in on its thickness, ie, noise. OK, that's a bit difficult to explain...
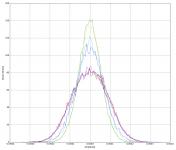
Post #16 shows the probability density function of noise at various offsets into the period, hand selected. This is the probability that the noise will have the value on the x axis. A narrow, sharp curve means noise is concentrated around 0. A flattened, wider curve means it is more spread out (therefore, noisier). They're all gaussians, which is nice.
I don't know.
If your ADC is DC-coupled, you can measure this by doing a FFT of various DC voltages. This will tell you if the noise frequency distribution changes.
Yes, because the idea is to compare points at the same offset into each period.
If you can't do synchronized measurement, you can use a slowly varying DC offset instead.
Therefore, no, because of synchronization.
However, I used a low pass filter with a rather low corner (150R-1u-1500R-100n) to eliminate the DAC HF noise, leaving only the LF sine.
I consider noise the standard deviation between each sample taken at the same offset in each period.
Signal shape does not matter actually. Sine is simpler, but as long as each period is repeatable and identical, it's OK. So, harmonics don't matter.
I like to use python and numpy for this. If you know those, I can share code...
First the noise modulation on the sine wave output from the DAC. I believe you are indicating that its significant on a cycle by cycle basis.
Yes. A sigma delta modulator generates lots of noise, shaping its spectrum to push most of it out of the audio band where it can be filtered out in the analog domain. Some modulators are better than others at this. More bits, higher modulator sample rate, and a better design, all help. Please don't ask about the details, I have no idea about how to design a S-D modulator... but they do have strange quirks... in fact these things are like deep physics, maybe ten people in the world really know how they work!
Now, I read in some ESS and Wolfson docs that the amount of noise depends on the current sample value being played. Their method was to plot noise versus DC offset. I wanted to replicate this, but my soundcard is AC-coupled.
Please check out this article.
According to ESS (page 3) it's a whole entire can of worms.
And they are in effect noise modulating the sine
We could model it with :
output = input + Fnoise(input)
with Fnoise being random noise whose amplitude depends on the input value (and perhaps its slew rate or recent history too according to Dustin!)...
And they don't show on a typical FFT
Nope
Consider a white noise signal n(t). Its spectrum will be flat.
Now, pick your favorite signal s(t), say a square wave which has values 0 or 1. Or pulses... or anything.
Multiply the two : output(t) = s(t) * n(t)
You get gated noise. When s(t)=1, there is noise. When s(t)=0, no noise.
Multiplication in time is circular convolution in frequency domain. Therefore,
spectrum(output) = spectrum
(convolved by) spectrum(s)...and your noise spectrum is flat. If you convolve a flat line with anything... you get another flat line. Whatever the spectrum of s(t) was, the FFT won't show it. All you get on screen is a noise floor...
See this post where I manufacture completely different signals which all have visually identical FFT.
but a statistical analysis of the amplitude density would show them?
Yes.
First way would be to output a slowly varying digital ramp to the DAC. Start at the most negative value, and increment slowly... Ac-couple it to get rid of the slowly rising DC voltage, and measure the RMS noise value. Either using analog circuitry, or a suitable amplifier followed by an ADC and software.
This would be the best way, as if you find a DC offset that makes the modulator misbehave, like output a short burst of oscillation, it'll be very visible.
Or you could script it to measure DNR on a -60dB sine with varying DC offsets... there are many ways.
You'd get sompething like Figure 6 in the above document... or maybe Figure 7. Quite a big difference in behaviour between the two!
I used a low frequency sine because it was simple and worked in AC-coupled mode (my soundcard is not DC coupled).
Imagine watching a scope screen. Every period of the sine is drawn in the same place, but noise thickens the trace. I do the exact same thing in software. It outputs a sine, records it, then stacks each period on top of all the others. Each sample at the same offset in each period should have the same value. The difference between them is noise at this specific offset into the period.
I can also capture with a USB scope with deep memory but only 10 bits resolution. Is that enough to see these issues? Could I notch out the fundamental and then see the modulation?
That could work but IMO it is much simpler to do it with the soundcard as both playback and capture are synchronized, so many periods can be accumulated.
Second, similar for ADC performance?
Same thing... they're sigma delta too...
I'm a little confused by your ADC noise plot. What is the difference between the three curves?
OK.
Post #14 shows RMS noise power (Y) depending on signal amplitude (X). Top is ADC, bottom is DAC.
Around ADC amplitudes +/- 0.25, noise increases.
Post #15 shows the same data, with different presentation. The sine shows where we are in the signla being played. The colorful background is a 2D histogram of the noise. The amplitude of each noise sample is on the y axis, and now many samples have this noise value is represented by the color.
Keeping in with the scope trace analogy, this is like seeing the signal on a scope : noise thickens the trace... but here, by substracting the signal, I make the trace flat, so I can zoom in on its thickness, ie, noise. OK, that's a bit difficult to explain...
Post #16 shows the probability density function of noise at various offsets into the period, hand selected. This is the probability
that the noise will have the value on the x axis. A narrow, sharp curve means noise is concentrated around 0. A flattened, wider curve means it is more spread out (therefore, noisier). They're all gaussians, which is nice.Different ADC's have different noise shaping. The AK5385 has the noise floor rising at about 30 KHz. The AK5394 doesn't start rising until more like 80 KHz. Does the frequency of the noise distribution relate to its amplitude distribution?
I don't know.
If your ADC is DC-coupled, you can measure this by doing a FFT of various DC voltages. This will tell you if the noise frequency distribution changes.
If the sine is not perfectly synchronous to the sample rate will the measurement fail?
Yes, because the idea is to compare points at the same offset into each period.
If you can't do synchronized measurement, you can use a slowly varying DC offset instead.
Can we separate the DAC from the ADC this way using a stable analog oscillator?
Therefore, no, because of synchronization.
However, I used a low pass filter with a rather low corner (150R-1u-1500R-100n) to eliminate the DAC HF noise, leaving only the LF sine.
Do harmonics degrade the measurement?
I consider noise the standard deviation between each sample taken at the same offset in each period.
Signal shape does not matter actually. Sine is simpler, but as long as each period is repeatable and identical, it's OK. So, harmonics don't matter.
I like to use python and numpy for this. If you know those, I can share code...
Last edited:
Hi! isnt this story just all about oscillator jitter... ?
I mean the idea of recording 20k period and analysing deviation from period to period is by essence some of the jitter measurement, right ?
I follow your post as I d love to tune my 0404 a bit and understand what s possible or not
I mean the idea of recording 20k period and analysing deviation from period to period is by essence some of the jitter measurement, right ?
I follow your post as I d love to tune my 0404 a bit and understand what s possible or not
Last edited:
- Status
- This old topic is closed. If you want to reopen this topic, contact a moderator using the "Report Post" button.
- Home
- Source & Line
- PC Based
- Test bench: E-MU 0202 USB