MarkMck,
I take it that you think the roughness in the Jordan high frequency response is what you refer to as edge hole as well?
You also mentioned (similar to the second modification for the W4-657s), is this referring to a previous post?
I take it that you think the roughness in the Jordan high frequency response is what you refer to as edge hole as well?
You also mentioned (similar to the second modification for the W4-657s), is this referring to a previous post?
It may be that the need for the mod applies only to certain vintages. My units don't show signs of edge termination artefacts: the frequency response is very smooth on and off axis in this region, and there's no characteristic "blip" in the impedance trace that usually betray a badly terminated cone.
Could yours be the older "s" version? Mine are the SB models.
The great thing about these drivers is that they are remarkably stable in response over a wide off axis, all the way to 4 kHz, and they require really little to no baffle diffraction compensation.
They're prime candidates for a transient perfect first order two way. The D26NC55 is a perfect candidate to mate with them: great sound, tiny faceplate allowing close coupling, fairly excellent low distortion in the lower frequencies, and pricing in line with the TB's.
Mount the tweeter very close, tilt the cabinet back slightly, then cross using a first order and the transient response, distortion, off axis, tonal balance everything will be improved over the single driver, even eq'ed. The crossover will take a trap on the woofer, the series coil, and maybe an impedance balancing leg just to give a general up or down tilt as required to blend. The high pass will be "quasi" first order: first order until about 900Hz then it'll quickly move to third. This is really an overdamped third order, and it sounds great. The extra orders allow a bit of phase rotation to bring the tweeter more in line with the woofer, the slow roll off through crossover maintains transient response, and the greater roll off provides much better power handling. I've been using this topology on and off since the mid 90s. After 3 years of trial and error, George Short just discovered this for himself in his latest Seas based flag-ship. The topology's a killer.
Modding the driver is a worthwhile endeavour and I'm sure it'll reap great rewards. I've philosophically opted for a different path, having run some preliminary measures and a lot of modeling to convince myself. I plan to button them together this winter.
Skepticism is a good thing. When claims of "perfection" are made we don't have to operate on "trust."
We can test for ourselves. It does not require a lot of money. There is an instrumentation microphone available for around 50 US. Add another 50 for a microphone preamp by the same company.
If you already have a Windows based PC with a full duplex soundcard, then you can use Audua's free SpeakerWorkshop to complete an impulse capable LMS measuring system.
100 dollars US (plus tax and shipping) for a quasi-anechoic measurement system. Amazing really.
Last, the Hobby HIFI tests of the new Jordan show no evidence of edge holes. What they do show is most likely material vibration modes of the cone and dust cap. This does not mean that the transducer does not have a problem with edge termination, but nothing is shown. And just like the outer material vibration modes, edge termination problems rarely are severe enough to show up in an imped. plot. Indeed, why would they?
Just wanted to do a quick follow up to my last post.
Healthy skepticism is universally applied. That goes as much for what I say and what I claim as it does for anyone else.
Healthy skepticism is universally applied. That goes as much for what I say and what I claim as it does for anyone else.
data revisited
I downloaded the data off the Dave's Web site. It was formatted as binary files instead of ASCII, but that was no problem.
In this and the next message I will attach impulse (time file), linear frequency response, waterfall, and step response.
There is a problem. I have an idea what it may be. For now, however, just look at the four interpretations of the time data and see if anything looks odd or out of place.
Attachments
Looking at the impulse (time data) attached to the last post, read the data from left to right. Each time the magnitude changes direction equals a "spike." Counting from the left, spikes four and six are the oddity or problem.
All other graphs are just interpretations of the same data. Still each one shows the problem.
All other graphs are just interpretations of the same data. Still each one shows the problem.
Attachments

LOL!
First test was to compare frequency responses, they both look the same (except for the window: I'm guessing Mark's isn't rectangular).
http://www3.sympatico.ca/dalfarra/W4657SB.gif
I haven't calculated step for this driver, but I caution not to take it out past 4 ms. My test set up is quasi anechoic to that time marker only. Anything past about 4 ms will include the very early room or floor contrinution too.
One thing to also be careful of is that the measures may have been taken with the furnace running. I always take 8 averages to get the SNR improvement, but this particular measure probably doesn't support the lower level granularity you're looking for in ETC type plots.
These were taken for frequency response, diffraction validation and to help chosse a tweeter.
I like your analysis though. What are you thinking may be happening?
Isn't that interesting!
I read your second post. Nice eye Mark!
MLS measurements (such as MLSSA, used in my test suite) are not robust when measuring non-linear systems. When MLS based measurement is applied to a non-linear test path, artificial "spikes" can appear in the impulse response.
For background:
http://ieeexplore.ieee.org/iel1/2190/10505/00487942.pdf?arnumber=487942#search="MLS nonlinearity"
Perhaps this driver has some serious linearity issues, not visible in the frequency response. I'm hoping these issues are at 8 kHz, near the break up, but now I plan on making near field THD and IM measurements, to double check this.
FWIW, I can guarantee the test equipment is linear: the MLSSA card, the mic, pre amp and measurement amp.
Let me also go back and double check the impulse, to make sure this is in the other off axis files.
All good stuff.
Re: Isn't that interesting!
One thing to keep in mind is that what seems cone breakup may not be cone, but could also be the spider for light weight metal cone drivers like these. Slightly wet the spider with a wet cotton swab around parts of the spider to find out. If there is a change, then you know that it is.
DDF said:I read your second post. Nice eye Mark!
MLS measurements (such as MLSSA, used in my test suite) are not robust when measuring non-linear systems. When MLS based measurement is applied to a non-linear test path, artificial "spikes" can appear in the impulse response.
For background:
http://ieeexplore.ieee.org/iel1/2190/10505/00487942.pdf?arnumber=487942#search="MLS nonlinearity"
Perhaps this driver has some serious linearity issues, not visible in the frequency response. I'm hoping these issues are at 8 kHz, near the break up, but now I plan on making near field THD and IM measurements, to double check this.
FWIW, I can guarantee the test equipment is linear: the MLSSA card, the mic, pre amp and measurement amp.
Let me also go back and double check the impulse, to make sure this is in the other off axis files.
All good stuff.
One thing to keep in mind is that what seems cone breakup may not be cone, but could also be the spider for light weight metal cone drivers like these. Slightly wet the spider with a wet cotton swab around parts of the spider to find out. If there is a change, then you know that it is.
Uh Oh
Mark,
I went back and looked at my TIM files in MLSSA on the measurement PC.
The reason I didn't notice the errant spikes in the impulse responses is because they aren't there. When viewed in MLSSA, there are absolutely no out of ordinary spikes in the impulse response.
I don't know if this is a fault with MLSSA are your post processing on my files. MLSSA applies no smoothing in the time domain, so the spikes should be clearly visible if they are there.
I don't know why your version of the same file looks different than that presented by MLSSA.
Dave
First, as to my now old posts, I was just using your raw data. I used what is called a "rectangular" window. I started the window where shown in the impulse response graph and ended it just before the first room reflection. The first room reflection may have been the floor. The first room reflection had not high frequency information. Could be a rug on the floor.
In the response, a little of the first room reflection may be present. The little tail at the end of the step response graph may be the floor.
Now, I have acquired a new W4-657SB. It is different than the S. The basket is taller and to match everything up, the VC former is taller. There is now more former in front of the spider before joined to the cone.
I have attached a comparison of the 657S and SB to this post. The two drivers differ in degree and not in kind. The SB is a poorer performer, but every error is still matching up.
Notice spikes four and five on the SB. Like what was found in Dave's mlssa data.
Lastly, although this is part of my professional life, I can map vibration modes. What we see here is cone and not spider.
Attachments
I'm not particularly familiar with the 657SB, but it certainly seems like the modes of the cone. What would you map the spider frequency to be? It certainly is more complicated to map than the cone.
There was an error in my posting of the IR and frequency response for the W4-657SB. I still had the passive equalizer from the 657S mod in the circuit. This bumped the high frequency output for the 657SB. My apologies.
I have attached a file to this message and the next showing the comparison performance of the stock 657S and stock 657SB.
The 4 dB increase in magnitude for the 7 kHz cone vibration mode is more than the previous modification design can handle. So a new design would be needed for the 657SB. Also, I do not know what additional changes might appear in the 657SC (listed as a new transducer on the TB Web site). PE is still shipping the 657SB.
The fluidity of the offerings from TB is disturbing. I had offered several free modification designs for TB transducers. I did this to help amateurs who might not want to spend the big bucks necessary for quality performance in a stock unit. Many of the designs I offered have been invalidated by the worsening of the performance in the updated designs. To date, I have not measured a Tang Band updated transducer that was not a poorer performer than its predecessor.
I do not have a problem with this. TB changes the model number when they change the transducer. As long as diyers carefully watch the model numbers, they will not have a problem. You must not, however, assume that a revised model is the same as or better than the old model. To date, this has not proven to be the case.
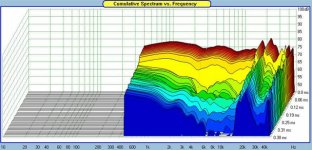
Anyway, I hope interested parties will find the comparison graphs useful or at least entertaining. If you have an opinion on what a 3D waterfall graph should show, let me know. Waterfall graphs are not used all that often and I find them more useful for design level analysis than A/B comparison of transducers.
Mark
I have attached a file to this message and the next showing the comparison performance of the stock 657S and stock 657SB.
The 4 dB increase in magnitude for the 7 kHz cone vibration mode is more than the previous modification design can handle. So a new design would be needed for the 657SB. Also, I do not know what additional changes might appear in the 657SC (listed as a new transducer on the TB Web site). PE is still shipping the 657SB.
The fluidity of the offerings from TB is disturbing. I had offered several free modification designs for TB transducers. I did this to help amateurs who might not want to spend the big bucks necessary for quality performance in a stock unit. Many of the designs I offered have been invalidated by the worsening of the performance in the updated designs. To date, I have not measured a Tang Band updated transducer that was not a poorer performer than its predecessor.
I do not have a problem with this. TB changes the model number when they change the transducer. As long as diyers carefully watch the model numbers, they will not have a problem. You must not, however, assume that a revised model is the same as or better than the old model. To date, this has not proven to be the case.
Anyway, I hope interested parties will find the comparison graphs useful or at least entertaining. If you have an opinion on what a 3D waterfall graph should show, let me know. Waterfall graphs are not used all that often and I find them more useful for design level analysis than A/B comparison of transducers.
Mark
Attachments

MarkMcK said:Attached to this message is the second part of the file containing the linear frequency response comparison and the waterfall plot for the 657S and 657SB
Lots of drivers seem to have this canel shaped response at the top. Which is an interesting thing to investigate.
Golly, 4" are really not much larger than 3" ones, yet they seem to decay lots slower. I wonder whether this has to do with the motor strength?
The "canal" shape to the high end is caused by two vibration (or breakup) modes of the cone. They are at different frequencies and start at different regions on the cone. Yes, it is common but never identical.
The waterfall plot shows many things. At the low end you are seeing the effects of Fs. At higher frequencies you see mostly cone artifacts. Motor differences will have little impact.
Mark
The waterfall plot shows many things. At the low end you are seeing the effects of Fs. At higher frequencies you see mostly cone artifacts. Motor differences will have little impact.
Mark
With the 3" drivers I've been playing with, above 1 Khz they decay at least 12db within the first 0.2ms or so. So if a driver had a narrow peak in the impedance, the decay would be faster in the lower frequencies?
I know that you have SoundEasy. Do you have any posts of data regarding the transducers you mention?
It is a good question with a complicated answer. Since we rarely do far field measurements down to Fs of even a three-inch driver we see just the upper freq skirt. This does not let us see the peak magnitude of Fs and we cannot judge its magnitude relation to the frequencies we do see.
It is a good question with a complicated answer. Since we rarely do far field measurements down to Fs of even a three-inch driver we see just the upper freq skirt. This does not let us see the peak magnitude of Fs and we cannot judge its magnitude relation to the frequencies we do see.
Here's one of the measurements. I'm still trying to identify in more of the finer things that effect sound that I don't see through the data yet. What is very interesting is that if treated properly, the transients and high frequency come out much more accurate.
Also looking at a few larger metal drivers.
Klippel recently announed a Cone Vibration module which is very good for cone study.
Also looking at a few larger metal drivers.
Klippel recently announed a Cone Vibration module which is very good for cone study.
Attachments
- Status
- Not open for further replies.
- Home
- Loudspeakers
- Full Range
- TB W4-657SB Measures