Do you plan on (extra) mids above/below the coax to narrow the vertical wave front? Or is it about getting equally smooth vertical/horizontal coverage.
The point of the configuration shown was to just have the coax on the front and not to narrow the vertical directivity. The coax radiating equally in both directions for both parts should result in an even early reflection response. I need to run some variations to see what comes out and one of those will be with the woofers either side in a vertical line.
that 3 db less to the front seems to be to be a loss of MaxSPL/sensitivity. Some of it may be returned supportively to the listener via reflections but it would be better if it didn't need to. Except for the loss ofMaxSPL/sensitivity, I wonder if it does any harm?
Its diffraction again, and baffle step, or side step in this case?😀 same as with woofer on baffle, some axial response boost and some attenuation to sides atop of the baffle step, the main diffraction hump. This time woofers are on the side(s) tho.
Power is pretty much flat its just that there is interference due to diffraction. Below this the response is roughly omni. There is no other problem than making the sound towards first reflections louder in comparison to direct sound, which makes the SBIR effect bit stronger but its bad already so. Make the box less deep and the problem goes away as "side baffle step" and diffraction moves up in frequency. Or crossover lower to the coaxial where both the coax and sidewoofers radiate roughly omni.
Power is pretty much flat its just that there is interference due to diffraction. Below this the response is roughly omni. There is no other problem than making the sound towards first reflections louder in comparison to direct sound, which makes the SBIR effect bit stronger but its bad already so. Make the box less deep and the problem goes away as "side baffle step" and diffraction moves up in frequency. Or crossover lower to the coaxial where both the coax and sidewoofers radiate roughly omni.
Last edited:
Having more of the sound put out to the sides and rear would not be too much of a problem in a large enough room. It isn't necessarily a reduction in on axis SPL either as there is no need for a baffle step correction when used in this frequency range.Except for the loss ofMaxSPL/sensitivity, I wonder if it does any harm?
It's edge, width and depth related. Each side driver is seeing a wide baffle with limited depth box which creates a cardioid like radiation but turned 90 degrees to normal. When there is two back to back you get this sort of diamond shape to the directivity when seen from above. The transition to full omni is quite low and there is more of a directivity interaction to a lower frequency than I was originally expecting.Its diffraction again, and baffle step, or side step in this case?
Is there possibility to plot and export polar map or frequency responses per angle from AKABAK instead? The top down view is kind of hard to read believe it or not 😀 although the shape is quite clear it is hard to visualize how the sound is further out as the colored fields seem to have 3dB interval and there seems to be multiple within few tens of centimeters of the box which seems weird. Isn't it showing near field response, which would even out bit further out? It would be easier to read polar maps as they are more common presentation here on forum, thanks!
Tried on VituixCAD and although it doesn't include the back edge diffraction, which is quite small in comparison to effect of the front, its easy to read the main effect of the opposing drivers from the polar plots. A baffle makes the cardioid like response as usual but other side included the response turns omni like higher up in frequency, basically DI is low to higher frequency. There is some wiggle to various angles, as in your top down view diamond shape, but its is very small in comparison to difference in DI, which is immense. This seems opposite to your observation and I'm concerned it should be straighten out if its the plots you posted and how we interpret them or what.
This is 40x100 baffle with two ideal woofers on it. Then copy of it is included rotated and spaced out 20cm to emulate opposing sides. This is front and back though, to keep the graphs familiar looking for easier comparison.
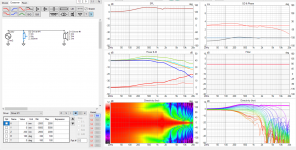
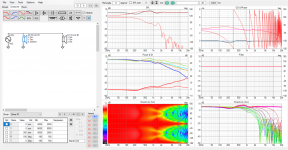


Last edited:
Sorry, poor wording and edit time over. Basically I'm just concerned about the plots and how we interpret them as it looks like there is possibility to draw very different observation from the top down image than from DI and polar plots. And the question is could you post polar plot please? it would clear things up. Thanks!🙂
ps.
I might have sounded harsh so I feel there is need for this post script. I have great respect to your contribution and simulations but it would be very very useful if you could export some similar graphs from ABEC / AKABAK as well, what we get from measurements and VCAD diffraction sim for example. This would help to compare things visually and relate the models better to other projects I think. I know VituixCAD diffraction sims do not give as accurate results as full 3D BEM sims you are doing but it is hard to compare without common output. I know from past sims that the difference is minor though, baffle sets the response and whats on the back makes some ripple to it varying with angle.
Last edited:
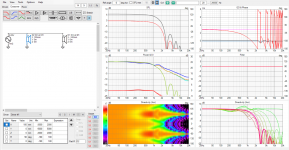
And for completeness the same but now the drivers point to sides as in the real system, changed the scale and directivity windows are not normalized and the diamond shape is there, pronounced at ~400Hz like in the top down plot I see.
Just for easy comparison here is the response from one side as if it was front, same as in previous post but with same scale as here.
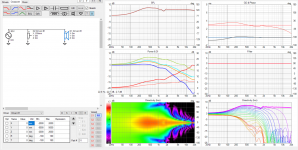
Another, "the diamond" shape lessens, in other words response goes closer to omni as the sources get closer to each other. It's bipole system after all 🙂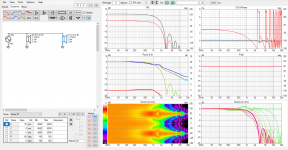
These polar plots show there is actually some frequency band where there is less sound to sides than to front and back, between 200-300Hz in above examples, and then there is more sound to sides than to front and back above that. Below ~200Hz about omni. This would be interesting to compare with the BEM sim.
edit.
looks to make fine system with ~300Hz crossover, sound to front dominates. Overall it resembles much situation if a woofer was on the narrow front.

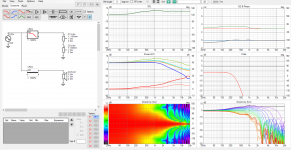

Just for easy comparison here is the response from one side as if it was front, same as in previous post but with same scale as here.

Another, "the diamond" shape lessens, in other words response goes closer to omni as the sources get closer to each other. It's bipole system after all 🙂

These polar plots show there is actually some frequency band where there is less sound to sides than to front and back, between 200-300Hz in above examples, and then there is more sound to sides than to front and back above that. Below ~200Hz about omni. This would be interesting to compare with the BEM sim.
edit.
looks to make fine system with ~300Hz crossover, sound to front dominates. Overall it resembles much situation if a woofer was on the narrow front.


Last edited:
Of course it is, I chose to post a regular old polar plot at the top end of the woofers response as I think that is the easiest to interpret.Is there possibility to plot and export polar map or frequency responses per angle from AKABAK instead?
The simulations were made with constant velocity which gives a very different view of the SPL curves but exactly the same normalized directivity. This is why the field values will look different but the shape of the directivity is what is being shown. How the drivers interact with each other at different frequencies to produce the pattern. This is exaggerated in the near field but it is pretty much the same shape just expanded further out.The top down view is kind of hard to read believe it or not 😀 although the shape is quite clear it is hard to visualize how the sound is further out as the colored fields seem to have 3dB interval and there seems to be multiple within few tens of centimeters of the box which seems weird. Isn't it showing near field response, which would even out bit further out?
I disagree which is why I didn't post them originally. A good way to compare for yourself is put Vituix into polar chart mode at the frequencies shown in the first few posts for horizontal and vertical. The vertical was a full 360 degrees.It would be easier to read polar maps as they are more common presentation here on forum, thanks!
And for completeness the same but now the drivers point to sides as in the real system, changed the scale and directivity windows are not normalized and the diamond shape is there, pronounced at ~400Hz like in the top down plot I see.
Are we on the same page now or do you still see differences in the data that are unexplained?
Thanks, this explains it.The simulations were made with constant velocity which gives a very different view of the SPL curves but exactly the same normalized directivity. This is why the field values will look different but the shape of the directivity is what is being shown. How the drivers interact with each other at different frequencies to produce the pattern. This is exaggerated in the near field but it is pretty much the same shape just expanded further out.
Are we on the same page now or do you still see differences in the data that are unexplained?
Yeah the data looks to be roughly the same just difficult to compare as its in different form. You are of course free to post data in any format.
The hard part is that in the polar chart single image represents only one frequency, whereas polar map shows the whole bandwidth in single image.
I'm not sure if you caught edits from my previous post but it seems the side woofers are not much different than front woofers in application, which is easy to read from the polar maps and line charts. Personally I would not trump the side woofers based on this. If looking the top down charts I'm with you, increased sound to sides looks bad but here in application and different chart the difference is not so big. Slight compromise here, if it means some more significant advantages (like the opposing force cancelling thing) might win. Also, no woofers on front making diffraction for the mid-tweet is a bonus. Of course no experience on if any of these are audible or preferable to each other and which situation.
edit.
Another angle on the line charts zoomed in, toggling sides on/off with 300Hz xo. The difference is quite a big, multiple dB, as already read in your top down images. It happens there at around the xo, where SBIR dip might reside and make it deeper as you already suspected. Directivity goes down below crossover.
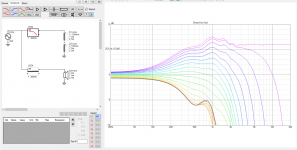
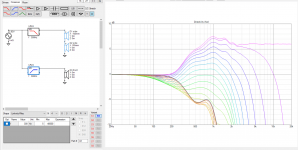
I kind of drew conclusion the difference might not be big but it is, whether it matters or not is perhaps positioning of the speakers.
I'm glad I posted these even if it all was moot, just to show importance of how to read the various plots and how misinterpretations might come up one way or another. I think it is always useful to check out stuff from many perspectives to get better handle on the situation.
Last edited:
Here is the thought I had initially that triggered me to post all this: if you are concerned the SBIR with sidewoofers or front woofer there is not much of a difference, its gonna be there bad in either case. More significant attenuation toward reflection is needed to get rid of it, another system altogether so not too bad of a drawback for side woofer arrangement compared to traditional box with woofer on front. Be sure to make it worthwhile, proper force cancellation, minimum diffraction for mid/high, reap the benefits, otherwise it's not worth it to worsen the bad SBIR obviously.
Here simple corner sim with close to corner and further away positioning, with and without sidewoofers. Its worse with sides especially with increased distance to the wall as demonstrated earlier but its nasty already so.
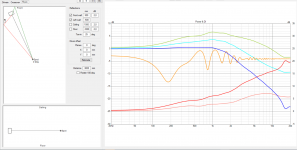
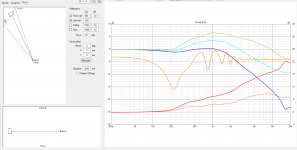
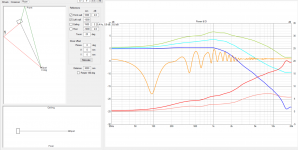
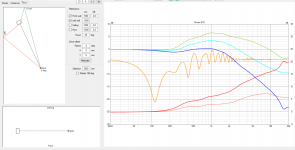
Here simple corner sim with close to corner and further away positioning, with and without sidewoofers. Its worse with sides especially with increased distance to the wall as demonstrated earlier but its nasty already so.


Last edited:
I didn't take it as being harsh, the problem is you don't know what I have and what I did and you have assumed that it will look the same and match Vituix.ps.
I might have sounded harsh so I feel there is need for this post script. I have great respect to your contribution and simulations but it would be very very useful if you could export some similar graphs from ABEC / AKABAK as well, what we get from measurements and VCAD diffraction sim for example.
It doesn't and it won't unless I change a lot about how I made the simulation and present the data. This is why I presented the data that is readable and understandable and left out the stuff that will confuse.
As far as I am concerned the Vituix sim is pretty close and you can use it as you have to get in the ball park.I know from past sims that the difference is minor though, baffle sets the response and whats on the back makes some ripple to it varying with angle.
I didn't but I have now. I don't see any real difference or contradiction to what I said.I'm not sure if you caught edits from my previous post
I said it was worse than I hoped for and that I didn't ideally want a speaker to output more sound to the sides than it did to the front. There is the free baffle step equalization and potential force cancelation along with the possibility of a more point source like speaker if the distances and crossover points are right as benefits. Basically not a complete win win unless room positioning or treatment can be leveraged to take the downsides away.Personally I would not trump the side woofers based on this. If looking the top down charts I'm with you, increased sound to sides looks bad but here in application and different chart the difference is not so big. Slight compromise here, if it means some more significant advantages (like the opposing force cancelling thing) might win. Also, no woofers on front making diffraction for the mid-tweet is a bonus. Of course no experience on if any of these are audible or preferable to each other and which situation.
Maybe you took what I said to mean something else or ascribed more weight to the negatives than I actually intended.
Your room simulations show precisely why you should never place your speaker 1m or so from both walls unless you really don't like kick drums 🙂
Yeah I think so, tried to point out its negative but not that bad....
Maybe you took what I said to mean something else or ascribed more weight to the negatives than I actually intended.
...
Hah, yeah its a nasty suck out for kicks 🙂 Honestly best way to combat this is to couple the speakers with the wall / corner, attenuating rear radiation there requires quite big speakers.Your room simulations show precisely why you should never place your speaker 1m or so from both walls unless you really don't like kick drums 🙂
Anyway, one more as I was just playing with the quick sim again and it is possible to actually introduce narrowing to the side/back and make SBIR a bit better even, if the high and low pass filters are overlapped some. Perhaps fine tune with delay if its a DSP system. This adds additional strain for the coaxial woofer though. The narrowing can be adjusted for better null towards the reflection point or for flatter DI very similar as with front woofers. Can tune higher DI for the whole 200-500Hz if you wanted. Project attached, its not anything directly buildable but something whipped up in a minute to draw conclusions with.
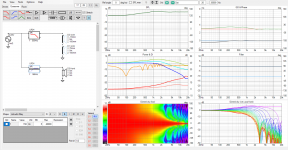
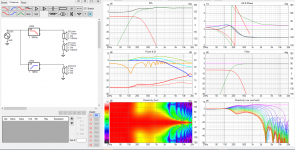
Attachments
Last edited:
The coax can and in my opinion should be overlapped with the woofers in the 200 Hz to 500 Hz range. These woofer response only analyses are helpful but pessimistic because overlap will improve things. Still the choice between side and front mounted woofers remains difficult especially when one doesn't have the option of trying both. Ironically, that is what KEF has done in offering both blade and reference models. I don't think the price difference is indicative of the sonic performance difference, though.
Overlap allows directivity change but has other disadvantages like increasing excursion. As the audible effect of that is not apparent in this kind of simulation it should not be ignored either.These woofer response only analyses are helpful but pessimistic because overlap will improve things.
I've tried a new layout of the side woofers to bring them closer together (black to blue circles). This changes the 1/4 wavelength frequency from each woofer to the coax from 320 to 410Hz give or take and should make for better looking simulated directivity.
I've got a drawing that looks a lot like that - rounded top. I think it looks nicer too.
What limits the closeness is the rear chamber for coax/mid.. The Sica seems to need very little volume so I guess we could 3d print a cap like you've drawn. I worry about not being able to get enough absorption in it to absorb the back wave though. From my vituix sims, it seems this driver configuration is quite tolerant of exceeding the 1/4 wave rule. Spacing the drivers vertically helps vertical directivity without introducing lobes near the listening window. The 1/4 wave rule is good for off axis out to 90 degrees. If you only care about +/- 45 degrees you can use greater spacing which means directivity control to lower frequencies. It seems a good idea for vertical spacing. Can't do it H without going to wider baffle...
What limits the closeness is the rear chamber for coax/mid.. The Sica seems to need very little volume so I guess we could 3d print a cap like you've drawn. I worry about not being able to get enough absorption in it to absorb the back wave though. From my vituix sims, it seems this driver configuration is quite tolerant of exceeding the 1/4 wave rule. Spacing the drivers vertically helps vertical directivity without introducing lobes near the listening window. The 1/4 wave rule is good for off axis out to 90 degrees. If you only care about +/- 45 degrees you can use greater spacing which means directivity control to lower frequencies. It seems a good idea for vertical spacing. Can't do it H without going to wider baffle...
My thought was to make a cross brace and mid enclosure combined. A resin filled cap might be a good idea but I wouldn't want just a basic print.What limits the closeness is the rear chamber for coax/mid.. The Sica seems to need very little volume so I guess we could 3d print a cap like you've drawn.
A layer of felt and some melamine or other foam should be enough, I drew the triangular shape with that in mind.I worry about not being able to get enough absorption in it to absorb the back wave though.
These drivers are vertically closer together than either is to the front. Without knowing the response of the coax more accurately I think it's hard to speculate on the best spacing to match. The point of this configuration was to try and be as point source as possible. If more vertical directivity from the woofers was desirable, the symmetric expanding layout on the front would make more sense to me and do away with the mounting difficulty of getting all the drivers close together.From my vituix sims, it seems this driver configuration is quite tolerant of exceeding the 1/4 wave rule. Spacing the drivers vertically helps vertical directivity without introducing lobes near the listening window.
Hi fluid,
If you want the raw data of the smaller Sica 5.5” in Klippel files format or in .txt for VituixCad, horizontal 0-90 deg, I could help you with that. Different box of course but it could point you in the right direction😉 Please pm me if interested.
If you want the raw data of the smaller Sica 5.5” in Klippel files format or in .txt for VituixCad, horizontal 0-90 deg, I could help you with that. Different box of course but it could point you in the right direction😉 Please pm me if interested.
I rebuilt my bathroom, toilet and laundry, then landscaped a few acres of ground... so it still remains on the todo list sometime after finishing the CNC and measurement turntable 🙂
PS My wife took the room where the speakers were in to become her home office, so now I have to wait till I renovate the last space in the house before I can put the speakers back in...
PS My wife took the room where the speakers were in to become her home office, so now I have to wait till I renovate the last space in the house before I can put the speakers back in...
- Home
- Loudspeakers
- Multi-Way
- Tachi - Coaxial Point Source BEM modelling