I decided to give the advanced model impedance fit a try. Strangely, I got very high inductance and a "sorry". 😛 I wonder if you could shed some light into what I may be doing incorrectly? According to my DATS3, I am supposed to have 1.219 mH.
Fit quality : SORRY :-(
Zero-mass error : 0.88
Full-mass error : 1.13
Electrical error : 1.75
Error (fail > 1) : 2.10
Datafile (JSON) : ADV20250103_170912.json
(wfit): Raw data : fmin = 1.03 | fmax = 20642.55
(wfit): Resampled data : fmin = 10.00 | fmax = 20642.55
(wfit): Initial Zm search interval : f1,f2 [Hz] = 35.27 -- 49.42
(wfit): Mechanical fit range [Hz] = 32.26 -- 45.50
(wfit): Electrical fit range [Hz] = 98.29 -- 6003.85
(wfit): Searching range 5.87 < Re < 11.74
(wfit): Mechanical error [%] = 0.496
(wfit): Electrical error [%] = 1.752 2.251
(wfit): Low-freq error [%] = 0.878 1.134
(wfit): Total error [%] = 2.102
(wfit): 3PC fit : fs = 40.31 Hz | Re = 9.55 Ohms | Cmes = 0.23 mF |Res = 117.42 Ohms | Lces = 58.79 mH
Parameter Value Unit
Re 9.55399 Ohms
Leb 1.39485 mH
L3 5.18981 mH
Le 6.48416 mH
Rss 449.629 Ohms
Ke 0.220335 SH
Bl 22.5057 Tm
Mms 115.106 g
R0 4.31363 kg/s
Rms 8.0487 kg/s
C0 0.116065 mm/N
Cms 0.126868 mm/N
beta 0.1316
f0 40.3133 Hz
fs 41.6481 Hz
Attachments
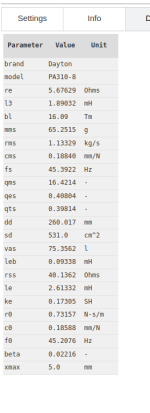
I did not, did not know it was an option. Currently testing a PA310-8 - This is working better. Came up with "good" now. 🙂
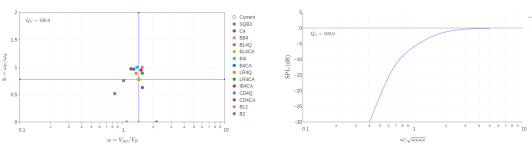
Could you share some insight into the lm(s)/Re(s) plot? I gather it is better to have a more negative Re(s) for dampening. I see some plots have tightly defined dots, while others are more spread out.
How critical is it to follow the Qts guidelines on the chart and the suggestions? My PA310-8 driver has a QTS of .39, so the chart indicates I should use a B4 ideally, than an LR4. However, get good results with BL4 - my upper rolloff will be around 450-500hz, which this alignment pushes the center resonance up to 800hz (which will happen to be rolled off). The dampening is better than the LR4 and BL4. It seems it limits the SPL until the port velocity goes up, but that is ok. I am considering 2 or 4 pa310-8's per channel.
This program is amazing! It really brings to light things I did not consider before. Thank you.
Attachments
-
 Screenshot from 2025-01-03 11-43-24.png37.1 KB · Views: 60
 -
 Screenshot from 2025-01-03 11-41-51.png36.9 KB · Views: 49
 -
 Screenshot from 2025-01-03 11-42-38.png109.3 KB · Views: 62
 -
 Screenshot from 2025-01-03 11-42-55.png30.1 KB · Views: 60
 -
 Screenshot from 2025-01-03 11-43-15.png102.7 KB · Views: 61
 -
 Screenshot from 2025-01-03 11-41-42.png57.3 KB · Views: 62
I'm glad to hear it's working. GOOD is not always easy to achieve!
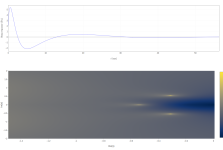
By the Re/Im plot, I think you mean the colored contour plot, correct? If so, this shows the system transfer function such that the location of the poles in the complex frequency plane are the bright white areas. It is a theoretically interesting plot related to the step response, but I don't think there is an immediate practical value. The step-response plot is probably more valuable in that it give a sense for how much "ringing" you will get for a given tuning.
The question of which alignment is best is a mostly subjective one and depends on the application. For a woofer in a classic 2 or 3-way design, I personally think the best overall alignment is probably the one that gives the most extended bass response (Chebyshev C4 is the general way to get this). Others will argue that reducing the group delay should weigh heavily in the choice. In general, a smooth SPL response without peaks (monotonic) is probably the most non-controversial recommendation. Your application seems to focus on high SPL without extended bass response, correct?
We will have a major new release of Speakerbench coming out soon, with a large amount of new documentation. Stay tuned and thanks for your questions and feedback!

Hello. This sounds very interesting.
I notice that your impedance model uses the square root of frequency (F^0.5) as the slope for the intermediate inductance. In practice, the slope when viewed on logarithmic scales is closer to F^0.6. This matches the slope given by a solenoidal coil on a steel slug due to eddy currents (without air inductance as a confounder), and seems to be a result of the geometry of eddy currents in a cylinder.
Of course, if heavy shorting rings are used then all bets are off in terms of the slope of the inductive region. But it would still be an improvement to use a very small exponent like F^0.1.
So I suggest using a variable exponent for your square root term to improve the accuracy here.
Here is a chart from a prior member showing the slope of the inductance affected by eddy currents:
@keantoken Interesting. Do you have the same analysis for one or more other drivers?
Also, without arguing for any particular model, one key consideration that may not be obvious is the need to fit and then subtract the electrical part of the total impedance very accurately in the vicinity of fs (below 200Hz) in order to precisely expose the motional impedance and associated creep compliance.
That said, how exactly would you modify the semi-inductance part of the attached impedance?
Attachments
Change
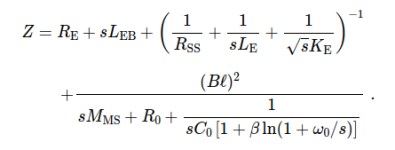
1/(sqrt(s)*K*E)
to
1/(s^X*K*E)
where X is a value between 0 and 1 which provides the best fit in the regions of impedance most important for the crossover.
I can't provide trend lines on my own measurements with RoomEQ unfortunately, but here is the Dayton SIG180-4. The region of maximally-flat phase for the inductance gives 57 degrees phase, which works out to an exponent of X=56/90=0.633

So our model for this woofer would include
1/(s^0.633*K*E)
SIG270-4 from Dayton data:

55/90 = X = 0.611
B652-Air woofer with blocked coil:

Without blocked coil (the coil position changed slightly):

TG9:

The Faital 3FE25 is more open to interpretation:

8/90 = X = 0.0889
TC9FD18 measurement from RajkoM:

13/90 = X = 0.144
1/(sqrt(s)*K*E)
to
1/(s^X*K*E)
where X is a value between 0 and 1 which provides the best fit in the regions of impedance most important for the crossover.
I can't provide trend lines on my own measurements with RoomEQ unfortunately, but here is the Dayton SIG180-4. The region of maximally-flat phase for the inductance gives 57 degrees phase, which works out to an exponent of X=56/90=0.633
So our model for this woofer would include
1/(s^0.633*K*E)
SIG270-4 from Dayton data:
55/90 = X = 0.611
B652-Air woofer with blocked coil:
Without blocked coil (the coil position changed slightly):
TG9:
The Faital 3FE25 is more open to interpretation:
8/90 = X = 0.0889
TC9FD18 measurement from RajkoM:
13/90 = X = 0.144
Attachments
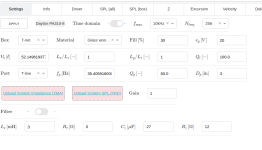
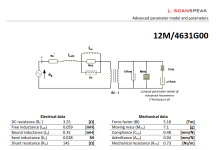
Note that in Speakerbench we are using 3 parallel elements (not one) to describe the semi-inductance. This is the Thorborg-Futtrup model also used by Scanspeak in their advanced parameter datasheet (see attached). In my recollection, Claus and I agreed to stick with this model because it performed well and also because it was at least tentatively adopted by Scanspeak. We would like to see broad adoption of the model as a standard.
(Aside: for the creep compliance we compared various more sophisticated models before adopting the Ritter 3-parameter creep model. So in that sense it is different than the Scanspeak advanced model).
To be clear, what is the complete electrical model you are proposing? Is it just using a single fractional power for the semi-inductance branch?
I think I did in fact try different exponents on the KE term (not just sqrt(s)) but didn't see any improvement in fitting quality, but it was years ago. It would take me some time to generalize the fitter for fractional powers here.
Attachments
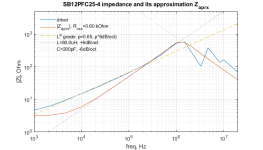
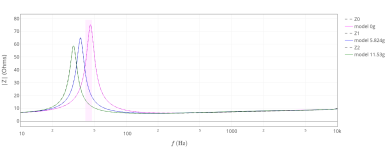
Here is an example of the model-versus-measurement comparison for a driver with a low inductance motor (SB Acoustics SB15NAC30-8). The model exactly recovers the suspension damping at lower frequency, which is our key performance metric. That is, the electrical model was assessed mostly at low and intermediate frequency in terms of it's performance in combination with the creep model. The quality of fit at 1kHz and beyond was not a key metric (although it is computed as part of the model error).
Attachments
My network currently looks like this:

Ke is a constant phase component, so the impedance of Lee and Ree always have the same ratio. I don't have a subcircuit for Ke, if pressed I would use procedural RL networks, but I prefer to work with pure slopes in the frequency domain when I can.
Ke can be a parallel network instead of a series network, which may be more convenient depending on what you do with it.
What level of accuracy would be good for a model in percent? I made a spreadsheet to test different ideas. The areas to the sides of Fs are difficult so far, I have yet to add the creep terms.
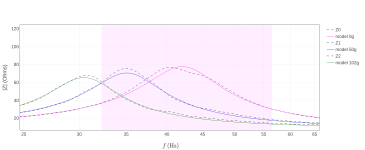
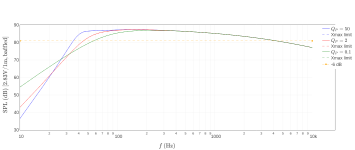
Small covered some aspects of step responses produced by vented systems, as shown in the following set of plots taken from his 1973 JAES paper. The C4 alignments do have somewhat of a downside in that their step response rings the most.The step-response plot is probably more valuable in that it give a sense for how much "ringing" you will get for a given tuning. ... The question of which alignment is best is a mostly subjective one and depends on the application. For a woofer in a classic 2 or 3-way design, I personally think the best overall alignment is probably the one that gives the most extended bass response (Chebyshev C4 is the general way to get this).
Of course, the C4 alignments are still very worthwhile when used with appropriate drivers, as they do allow those drivers to achieve lower cut-off frequencies, as shown below.
I've found that it is possible to very accurately model the "inductive rise" in loudspeaker impedance functions independently of electromagnetic theory using an empirical approach ("An Empirical Model for Loudspeaker Motor Impedance", J.R. Wright, Celestion International Ltd., J. Audio Eng. Soc., Vol. 38, No. 10, pp. 749–754, October 1990). This approach may be amenable for incorporation into SpeakerBench.
The general expression for the motor impedance can be written as:
Z(2πF) = Re + Motional impedance + Kr×(2πF)^Xr + j Ki×(2πF)^Xi
At high frequencies the effect of the motional impedance can be neglected, so we are left with the simpler expression given below:
Z(2πF) = Re + Kr×(2πF)^Xr + j Ki×(2πF)^Xi
Now, in order to estimate the values of the four unknown parameters, (Kr, Xr, Ki, Xi), we need to measure the complex electrical impedance at two high frequencies F1 and F2,
Z1(2π×F1) = Re + Kr×(2π×F1)^Xr + j Ki×(2π×F1)^Xi = M1×(cos(P1) + j sin(P1))
Z2(2π×F2) = Re + Kr×(2π×F2)^Xr + j Ki×(2π×F2)^Xi = M2×(cos(P2) + j sin(P2))
as well as knowing the value of the voice-coil dc resistance Re, which is easily obtained.
M1 and P1 are the magnitude and phase of the impedance Z1 at frequency F1, and M2 and P2 are the magnitude and phase of the impedance Z2 at frequency F2.
The unknown parameters, (Kr, Xr, Ki, Xi), can then be determined from the following four equations
Xr = log(R2/R1)/log(F2/F1)
Xi = log(I2/I1)/log(F2/F1)
Kr = R1/(2π×F1)^Xr
Ki = I1/(2π×F1)^Xi
where
R1 = M1×cos(P1) - Re
I1 = M1×sin(P1)
R2 = M2×cos(P2) - Re
I2 = M2×sin(P2)
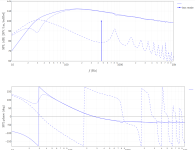
It has been possible to use a nonlinear least squares solver to determine the parameters (Kr, Xr, Ki, Xi) when performing impedance curve fits of loudspeaker drivers. An example result of a woofer impedance curve fit is shown below.

Another model with fewer parameters can model the inductance rise using the following expression. I believe that this particular model has minimum-phase characteristics, and the mathematical expression used for calculating the contribution to the impedance is shown below.
Z = Re + Motional impedance + Kmp×{cos(Xmp×π/2) + j sin(Xmp×π/2)}×(2πF)^Xmp
The unknown parameters (Kmp, Xmp) are also amenable to estimation using nonlinear least squares. Initial estimates can be obtained from magnitude-only impedance response data.
The general expression for the motor impedance can be written as:
Z(2πF) = Re + Motional impedance + Kr×(2πF)^Xr + j Ki×(2πF)^Xi
At high frequencies the effect of the motional impedance can be neglected, so we are left with the simpler expression given below:
Z(2πF) = Re + Kr×(2πF)^Xr + j Ki×(2πF)^Xi
Now, in order to estimate the values of the four unknown parameters, (Kr, Xr, Ki, Xi), we need to measure the complex electrical impedance at two high frequencies F1 and F2,
Z1(2π×F1) = Re + Kr×(2π×F1)^Xr + j Ki×(2π×F1)^Xi = M1×(cos(P1) + j sin(P1))
Z2(2π×F2) = Re + Kr×(2π×F2)^Xr + j Ki×(2π×F2)^Xi = M2×(cos(P2) + j sin(P2))
as well as knowing the value of the voice-coil dc resistance Re, which is easily obtained.
M1 and P1 are the magnitude and phase of the impedance Z1 at frequency F1, and M2 and P2 are the magnitude and phase of the impedance Z2 at frequency F2.
The unknown parameters, (Kr, Xr, Ki, Xi), can then be determined from the following four equations
Xr = log(R2/R1)/log(F2/F1)
Xi = log(I2/I1)/log(F2/F1)
Kr = R1/(2π×F1)^Xr
Ki = I1/(2π×F1)^Xi
where
R1 = M1×cos(P1) - Re
I1 = M1×sin(P1)
R2 = M2×cos(P2) - Re
I2 = M2×sin(P2)
It has been possible to use a nonlinear least squares solver to determine the parameters (Kr, Xr, Ki, Xi) when performing impedance curve fits of loudspeaker drivers. An example result of a woofer impedance curve fit is shown below.
Another model with fewer parameters can model the inductance rise using the following expression. I believe that this particular model has minimum-phase characteristics, and the mathematical expression used for calculating the contribution to the impedance is shown below.
Z = Re + Motional impedance + Kmp×{cos(Xmp×π/2) + j sin(Xmp×π/2)}×(2πF)^Xmp
The unknown parameters (Kmp, Xmp) are also amenable to estimation using nonlinear least squares. Initial estimates can be obtained from magnitude-only impedance response data.
Gentlemen, thanks for all the comments about impedance models! Claus and I have published a few AES articles on the general topic of transducer modeling. It's probably too deep a discussion for this forum, but I do want to emphasize a few key points that are normally missed:
- the compliance and motor inductance models should be analytic functions of the Laplace parameter s (Candy and Futtrup 2018)
- the clean separation of motional from electrical impedance is the key challenge for modeling accuracy (Candy and Futtrup 2017)
- the critical improvement in physical accuracy comes mainly from the frequency-dependence of damping (see attached)
Attachments
Thanks for the references, they answer most of my questions.
How would you model an aperiodic enclosure in Speakerbench?
How would you model an aperiodic enclosure in Speakerbench?
I've found that it is possible to very accurately model the "inductive rise" in loudspeaker impedance functions independently of electromagnetic theory using an empirical approach ("An Empirical Model for Loudspeaker Motor Impedance", J.R. Wright, Celestion International Ltd., J. Audio Eng. Soc., Vol. 38, No. 10, pp. 749–754, October 1990). This approach may be amenable for incorporation into SpeakerBench.
Thank you for this information. It is an interesting idea to use different powers for the inductance and resistance terms. Unfortunately it is more the low-hanging fruit for speaker modeling as the suspension behavior is more important to get right, which is what the current model excels at. Modeling the inductance precisely becomes more important when using a notch filter on a woofer, or possibly when using a series crossover. If we want to use current drive however, Le definitely must be modeled accurately (especially for full range drivers). But the current model still models Le very well, so this is all beginning to look like a non-issue. I am beginning to feel like I stirred the pot for no reason. Note that the errors given in the references are on the order of 0.1ohms or less, although it could still be improved for Le.
You could simply use the vent Q (Qp), making it small. In the limit Qp -> 0, the enclosure becomes sealed.Thanks for the references, they answer most of my questions.
How would you model an aperiodic enclosure in Speakerbench?
Attachments
- Home
- Loudspeakers
- Multi-Way
- Speakerbench