Finally the right circuit!fa meno il fenomeno
Fai meno simulazioni e studia
Engl: less simulation more study
The Rp of 300B is around 800 ohm not 1600!!!
Walter
I don't know what he is simulating there but with simple math just looking at the circuit , at 10Hz and 24H primay RL to ground is about 1500 ohm , almost like Rp , so roughly only half voltage will get through the voltage divider , 6dB loss already without other loses
Rp should be a valid DC operating point , how much voltage across the tube and current for 800ohm ? That is just datasheet value
For 300V and 60mA the Rp is 5K ... so the real result is much worse , the transformer inductance 24H could be enough but is not very good
Rp should be a valid DC operating point , how much voltage across the tube and current for 800ohm ? That is just datasheet value
For 300V and 60mA the Rp is 5K ... so the real result is much worse , the transformer inductance 24H could be enough but is not very good
Last edited:
@waltube
I still don't get why using Thevenin or Norton equivalent circuit should give any difference.. and in fact the result of the simulation is the same.
You might be a bit of a grumpy old dude who doesn't like simulations, but that's how the world goes nowadays.
For Rp I used 800 ohm in my first simulation, but you told me to use the model from the other user who had Rp=1700 Ohm in his simulation, so I trusted you can changed Rp
BTW, I have a master degree in EE and I manage a team or 15 engineers. I new to tube amplifications, but I definitely know the basics of electronics very well.
Because for AC and impedances is not correct , the Rp that you only moved in parallel with the current source becames a impedance
The Rp of 300B with 300 vdc and 60 mA is 740 ohm as WE data sheetI don't know what he is simulating there but with simple math just looking at the circuit , at 10Hz and 24H primay RL to ground is about 1500 ohm , almost like Rp , so roughly only half voltage will get through the voltage divider , 6dB loss already without other loses
Rp should be a valid DC operating point , how much voltage across the tube and current for 800ohm ? That is just datasheet value
For 300V and 60mA the Rp is 5K ... so the real result is much worse , the transformer inductance 24H could be enough but is not very good
With some other brand something vary
I wiil look on my datas the dynamic test done with my Sofia on this tubes
Walter

Rp for triodes is just Ohm's law 300V / 0.06A = 5K
Very easy to calculate no black magic ...
If not must be another internal resistance to limit the current
In datasheet Rp or Ri is just the relation between miu and transconductance , both max values .
Very easy to calculate no black magic ...
If not must be another internal resistance to limit the current
In datasheet Rp or Ri is just the relation between miu and transconductance , both max values .
Last edited:
Rp for triodes is just Ohm's law 300V / 0.06A = 5K
Very easy to calculate no black magic ...

This is one copy, not from my tests
The dot is the point to get the data on the right and can be a right working point
The Rp is calculated from curves
Walter
Last edited:
You changed Rplate and Rsr values.@Depanatoru
If I replace the current generator with a voltage generator, the result is the same. I might be omitting a high pass component in the model, I am not sure..
View attachment 1267038
View attachment 1267041
@waltube fa meno l'arrogante vala'
That affects the damping factor, hence the increase of the peaking.
You should understand that Rp is not a fixed or real number , the internal resistance varies from infinity when the tube is in cutoff to a low value with zero bias .
This is one copy, not from my tests
The dot is the point to get the data on the right and can be a right working point
The Rp is calculated from curves
Walter
As we can see the angle of the curves varies from 0V bias to the most negative ones . Vertical is of course 0 ohm and horizontal infinity
Gm = miu / Rp , in a real amplifier all this are variables depending on operating point , load
The tracer will chose the "best case scenario" or something like this
Last edited:
No need to hassle about it. Most of us are aware the Rp value is dynamic.
A simple solution would be to average or add more to the Rp value in order to simulate the worst case of the frequency response lower roll-off, considering a higher Rp acts in a negative way.
I'm amazed to see people arguing over details, which might not be of much importance within the context of discussion. I find the initiative of member @marcomariutto of attempts of simulating the bottom frequency response on a triode stage using an OPT on reactive speaker loads already quite interesting and valuable.
Sofia calculate the value as theory says (well explained in Radiotron chapter 2) not from other facts.The tracer will chose the "best case scenario" or something like this
And fully agree on Rp but from one point we can start and it can be a suggested workin point.
Thank you @50AE
One of the difficulties I see here, to have an accurate simulation, is that the Zload seen by the tube changes as the frequency change, and by changing Zload also Rp changes.
At f>>fs, Zspeaker << ZLp, so the tube sees Zload = Zspeaker
At f = fs, Zspeaker >> ZLp, so we can approximate Zload = ZLp.
At f < fs, both Zspeaker and ZLp are low and Rpri contribution starts being relevant.
I think an approach could be to estimate Zload for a few given frequencies (e.g. 10, 20, 40, 80 Hz) and from there determine Rp.
Once Rp and Zload are known, the attenuation can be also determined.
Rplate should be independent of Zload. Sure, it's dynamic, but constant in parameters.
The loadline slope changes depending of the reflected load, vs Rp.
You get different Rload/Rp ratios, which practically determine the DF at the specific frequency @ impedance.
Yes, you can pretty much observe how the loading nature shifts. And all resistance values play a role. Basically the DF.
Simulations are fun. I'm experimenting with HF transformer modelling, attempting to recreate different interleaving configurations into a spice model.
Yes, I do. Exactly, too many capacitance and leakage inductance value. Here's an experiment. This should be a representation of 1:1 transformer with two interleaving interfaces, S / P / S. The goal of the model was to play around with different values and observe how the frequency response behavior changes. Considering the model has built in transformers per each layers, hence impedance conversion, the capacitances can be the static value ones.
Attachments
Valve mu derives from a horizontal line drawn at the operating (idling) point; transconductance derives from a vertical line through that same point. Rp (equals mu/transconductance) is the slope of a tangent to the constant grid voltage line.
There's a lot of misinformation in this thread, but none by the OP. Others should investigate Norton/Thevenin equivalents.
All good fortune,
Chris
There's a lot of misinformation in this thread, but none by the OP. Others should investigate Norton/Thevenin equivalents.
All good fortune,
Chris
@50AEYes, I do. Exactly, too many capacitance and leakage inductance value. Here's an experiment. This should be a representation of 1:1 transformer with two interleaving interfaces, S / P / S. The goal of the model was to play around with different values and observe how the frequency response behavior changes. Considering the model has built in transformers per each layers, hence impedance conversion, the capacitances can be the static value ones.
There a lot of elements in that model. I am wondering if for such complex networks using a programming language with a matematical library to create the model would be more practical..
Unfortunately, my math and programming skills are on the low side. However I'm pretty certain that higher amount of interleaves add to the complexity to the model, as the count of capacitance bridges is increased. In a perfect world, you need to treat every layer as a separate transformer, interconnected capacitively and inductively to its surroundings. There are also additional RLC networks that form themselves and textbooks don't mention them, it is easy to miss them, such as capacitance bridging between separate primary windings via secondary layers due to capacitive difference. SE are harder than PP transformers because of this, because their voltage potential is different between each secondary layers. PP transformers are capacitively balanced in nature, which done right, doesn't cause RLC bridges like SE transformers do. This can cause trouble with series connected secondary layers. There is an abundance of examples. In some transformers, you need primary layers splitting, specific layer rotation, etc.
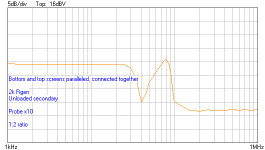
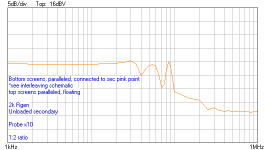
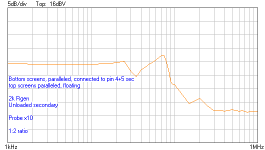
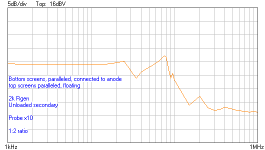
Check this recent experiment. An 1:2 SE IT transformer which I left on on storage on the shelves, because frequency response is a bit unacceptable. Same transformer, same interleaving, but 2 pairs of electrostatic screens are present between P/S layers. You can observe that there is headroom for resonance tweaking, depending on the way you connect them. Note that if using screening, every type of transformers requires different screen connections for optimal results. In some applications, I've dumped part of the secondary signal (from a tap) into a screen to smooth out resonances.
P/S The measurement with a different primary connection is a good example of capacitance dumping from primary/secondary to primary/primary. Notice the disappearance of the dip resonance, but increased Q factor of peaking resonance and lowered frequency. A series resonance is more easily tamed by loading or higher driving impedance.
Attachments
-
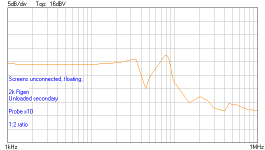
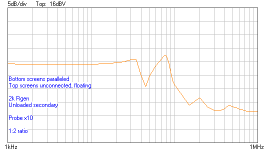 Bottom screens paralleled, unloaded sec, 2kRgen.png2 KB · Views: 50
 -
 Bottom and top screens paralleled, unloaded sec, 2kRgen.png1.8 KB · Views: 54
 -
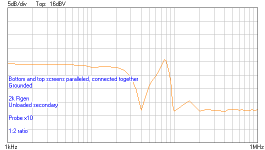
 Bottom and top screens paralleled, connected together, unloaded sec, 2kRgen.png1.8 KB · Views: 57
 -
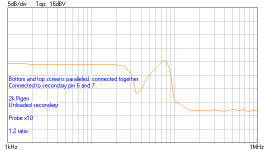 Bottom and top screens paralleled, connected together, pin 6+7, unloaded sec, 2kRgen.png2 KB · Views: 53
 -
 Bottom and top screens paralleled, connected together, grounded, unloaded sec, 2kRgen.png2 KB · Views: 55
 -
 4 (Best).png2.3 KB · Views: 42
 -
 3 (BEST).png2.2 KB · Views: 51
 -
 2.png2 KB · Views: 45
 -
 1.png2.1 KB · Views: 46
 -
 SCREENS FLOATING, unloaded sec, 2kRgen.png1.8 KB · Views: 60
Last edited:
The simulation of @euro21 is with the 45 tube. That is why Rp is 1700 ohm.
To know the cut off at low frequency, compute Req which (Rp + Rdc) in parallel with the nominal load. Rdc is the total winding resistance. So, Rdc is the primary resistance plus the secondary resistance multiplied by the square turn ratio. Then f(-3db) is simply 2*pi*L/Req.
Referring to the data in @euro21's circuit for Rdc and L, f(-3db) is just over 10Hz with the 45 (Rp=1700R) and just over 7Hz with 300B (Rp=800R).
This is a good approximation and simulation will not tell anything significantly different, unless REAL parameters are used. In fact, @euro21's simulation says 9.6Hz for the 45. Plate resistance and fixed inductance are already approximations. What is the point of simulating something so simple to estimate?
@45 The goal of my simulation is to take into account of the loudspeaker impedance variation with the frequency. The impedance of the loudspeaker driver influences the frequency response of the output stage, and assuming the loudspeaker driver is a 8 Ohm resistor across the whole frequency spectrum is not accurate.
Last edited:
- Home
- Amplifiers
- Tubes / Valves
- Simulate OPT SX-11 at low frequency