So, what is the mechanism of the problem? Why, in your opinion, distortion increases with the source's output impedance increase?
Look for the drain-gate characteristics of the field effect transistor and effect Earley.
The signal voltage changes the voltage of the gate-drain (base-collector for bipolar) and at the same time, its drain current (the collector). Nonlinear.
Hence, there will be distortion.
But the "MultiSim", if he doesn't show it, it is urgent to throw in the trash. 😀
Yes, it is.
This is evident in practical measurements and the model.
ok
i will run the measured test again on proto #2 , it is on bench not yet complete . I will use same 1k external in series and then 1M in series.
I assume you mean 'any' topology ie open loop , no global, no bootstrap , bias fixed, bias virtual , fet / tube / bjt or ps config?
-
This will help to see the problem. On the other hand, the output impedance of the volume control about 1/4 of his resistance.ok
i will run the measured test again on proto #2 , it is on bench not yet complete . I will use same 1k external in series and then 1M in series.
I assume you mean 'any' topology ie open loop , no global, no bootstrap , bias fixed, bias virtual , fet / tube / bjt or ps config?
No exceptions. In addition to amplifiers specifically designed to reduce this problem.
Look for the drain-gate characteristics of the field effect transistor and effect Earley.
The signal voltage changes the voltage of the gate-drain (base-collector for bipolar) and at the same time, its drain current (the collector). Nonlinear.
Hence, there will be distortion.
But the "MultiSim", if he doesn't show it, it is urgent to throw in the trash. 😀
jFETs experience the effect, similar to BJT's Early effect - channel-length modulation, however, in a source follower line stage, its influence is very subtle and not related to output impedance of the signal source.
I was not 100% correct, saying the distortion level does not change with signal source impedance increase - the effect takes place at the higher end of audio bandwidth in case the jFET is "slow" enough (like 2SK170). The reason is rather high input capacitance (Ciss + Crss), changing in sync with Vds and Vgd accordingly.
In case some "faster" jFET is used (e.g. 2N5484 - the one I used in my simulation, or 2N5461 - used in post #11), the effect is not noticeable.
Multisim is fine - same SPICE simulation engine.
This effect was discovered and when used in input stage RF jfet and bjt, and even OpAmp. In the input stage OpAmp installed transistors with a cutoff frequency of the gain current to a few gigahertz - they were by no means slow.
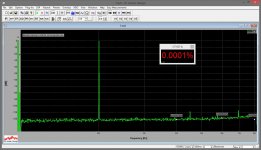
Here the same model with the 2N5484 at the input. With the change in R from 1K up to 100k THD increases from 0.002,6% to 0.077%. You'll have to throw "Multisim". He's lying to you, and it is unforgivable.
Here the same model with the 2N5484 at the input. With the change in R from 1K up to 100k THD increases from 0.002,6% to 0.077%. You'll have to throw "Multisim". He's lying to you, and it is unforgivable.
Attachments
Last edited:
cut bait or fish
Here are the results. I'll keep it on the bench for a day or so in case any measure request.
The file names describe test.
example: nr2-6db-fft-1M is fft waterfall -6db input with external 1M series on input.
Notes:
R2 optimum value on nr 2 proto is 10k
Semis are random picked, no culling.
THD is a little lower on proto 2.
R4 is/was 100ohm on nr1 and nr2. Schematic shows 470.
Bias is adjusted for best *overall* thd.
3.3k dummy load resistor on output
0 db is 770mv rms sine
No other connections, panel pots on box are for other ckts.
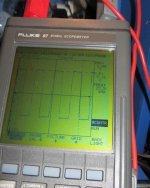
I will upload a pic of 25khz sq wave later today. It looks fine.
Interesting the THD is/appears lower with the 1M. I suspect its because of some input attenuation.
Have to move on now to power section. The pre is released now. In Texas we say cut bait or fish.
Wasting too much time on simulators.
Here are the results. I'll keep it on the bench for a day or so in case any measure request.
The file names describe test.
example: nr2-6db-fft-1M is fft waterfall -6db input with external 1M series on input.
Notes:
R2 optimum value on nr 2 proto is 10k
Semis are random picked, no culling.
THD is a little lower on proto 2.
R4 is/was 100ohm on nr1 and nr2. Schematic shows 470.
Bias is adjusted for best *overall* thd.
3.3k dummy load resistor on output
0 db is 770mv rms sine
No other connections, panel pots on box are for other ckts.
I will upload a pic of 25khz sq wave later today. It looks fine.
Interesting the THD is/appears lower with the 1M. I suspect its because of some input attenuation.
Have to move on now to power section. The pre is released now. In Texas we say cut bait or fish.
Wasting too much time on simulators.
Attachments
-
 nr2-0db-thd-1M.png34.1 KB · Views: 162
 -
 nr2-0db-fft-stock.png49.6 KB · Views: 140
 -
 nr2-6db-fft-stock.png54.7 KB · Views: 140
 -
 nr2-6db-thd-stock.png34.5 KB · Views: 481
 -
 nr2-0db-thd-stock.png34.2 KB · Views: 479
 -
 nr2-6db-thd-1M.png34.2 KB · Views: 494
 -
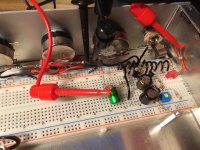 1Meginseries.jpg279.2 KB · Views: 500
 -
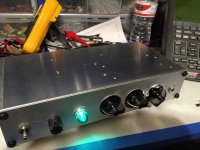 p2case.jpg233.7 KB · Views: 531
Last edited:
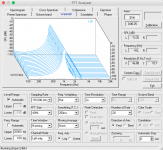
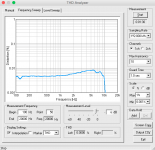
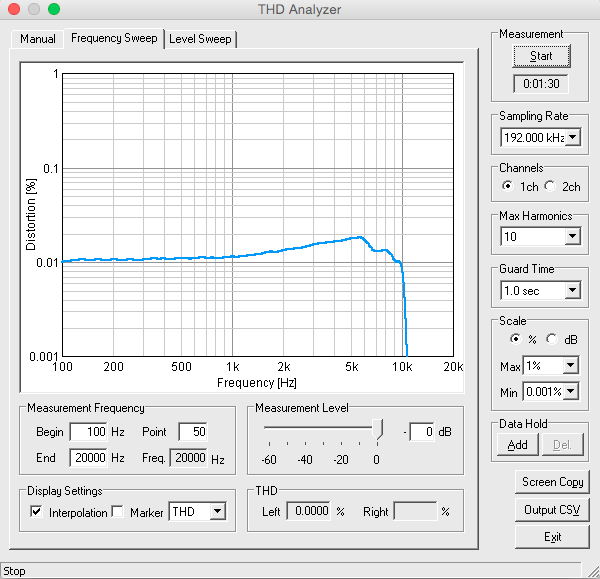
Note that either sample rate is not set up correctly (I am guessing the hardware setting cannot be adjusted from within the emulator environment) or measurement bandwidth is restricted to ~20 kHz somewhere.
Very interesting to see a dominant 3rd on a circuit like that... possibly a result of output loading.
Very interesting to see a dominant 3rd on a circuit like that... possibly a result of output loading.
Hi!Here are the results.
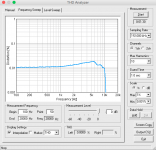
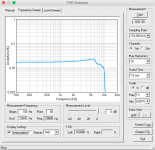
Doesn't it bother you a strange move frequency response distortion http://www.diyaudio.com/forums/atta...mple-discrete-sziklai-pre-nr2-0db-thd-1m.png: the rise from 1 kHz to 6 kHz, then the same for all the graphs the shape of the recession? Why suddenly they began to grow from 1 kHz, and why decreased after 6 kHz, if there is no resonant circuits or frequency-dependent circuits for these frequencies?
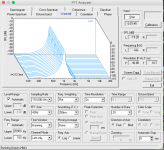
the harmonic signature can be tweeked with bias setting.
ie dominant 2nd or 3rd or 50-50.
the distortion really is that low, i did a lot of checking.
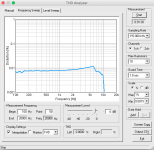
the first set of data shows response plot.
the peak - drop is only on the sz circuit. a simple fet-classA will present
a plot you are accustomed to.
the steinberg ur22 does roll off around 22-25khz. its not the best but for price/performance is great. i wanted midi din ports.
ie dominant 2nd or 3rd or 50-50.
the distortion really is that low, i did a lot of checking.
the first set of data shows response plot.
the peak - drop is only on the sz circuit. a simple fet-classA will present
a plot you are accustomed to.
the steinberg ur22 does roll off around 22-25khz. its not the best but for price/performance is great. i wanted midi din ports.
Last edited:
Hi!
Doesn't it bother you a strange move frequency response distortion http://www.diyaudio.com/forums/atta...mple-discrete-sziklai-pre-nr2-0db-thd-1m.png: the rise from 1 kHz to 6 kHz, then the same for all the graphs the shape of the recession? Why suddenly they began to grow from 1 kHz, and why decreased after 6 kHz, if there is no resonant circuits or frequency-dependent circuits for these frequencies?
Hi Victor, these are actually THD graphs (not the frequency response), taken on a rather narrow-bandwidth sound-card based analyzer...
Sound cards, the bandwidth which would have been more than 50 kHz, a very small amount. In fact, I never even heard of such. 🙂 Most likely, the bandwidth is limited by the internal filters. But bandwidth 50 kHz is not sufficient to judge the harmonics of the fundamental tone 20 kHz higher than the second (40 kHz). It is better to measure intermodulation distortion in the test 19/20 kHz. The difference frequency of 1 kHz 18-21 kHz see all the cards.
This effect I saw "iron" instruments, such as distortion meter with a bandwidth up to 200 kHz.
This effect I saw "iron" instruments, such as distortion meter with a bandwidth up to 200 kHz.
Last edited:
Hi, Valera!Hi Victor, these are actually THD graphs (not the frequency response), taken on a rather narrow-bandwidth sound-card based analyzer...
Harmonics of the fundamental frequency are signals with frequencies multiple to the main one. Therefore it is always necessary to ensure that the bandwidth of the device exceeded the maximum frequency to the highest harmonic. For the audio range, this band should be 200 kHz to take into account all harmonics up to the 10th harmonic of 20 kHz. And then, 10 harmonics is a little.
If because of limitations of the frequency range of the measuring device it is impossible to look and evaluate the higher harmonics, a good way is to measure IMD in the test 19/20 kHz. It takes into account only those components, that fall into the audio range.
Sound cards, the bandwidth which would have been more than 50 kHz, a very small amount. In fact, I never even heard of such. 🙂 Most likely, the bandwidth is limited by the internal filters. But bandwidth 50 kHz is not sufficient to judge the harmonics of the fundamental tone 20 kHz higher than the second (40 kHz). It is better to measure intermodulation distortion in the test 19/20 kHz. The difference frequency of 1 kHz 18-21 kHz and see all the cards.
This effect I saw "iron" instruments, such as distortion meter with a bandwidth up to 200 kHz.
Yes sure, I don't know what exactly jfetter is using, but his graphs are limited at around 10KHz by some reason.
I am using a pro-grade Lynx L22 together with pro-grade German Dr Jordan Design's measurement solution.
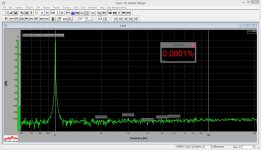
100KHz analog bandwidth, 0.0001% external-loop distortion within 20Hz-20KHz bandwidth. High-enough precision instrument. See attached.
The only disadvantage is the price (around $1000 USD new in Moscow) 😉
Attachments
im workin on output section right now but next time pre on bench i do
thd and response scale to 25khz.
thd and response scale to 25khz.
I like to measure the distortion for a frequency of 20 kHz. Due to the decrease of loop gain where they are much higher, they are more visible, and if there is they are small, especially they are small at other frequencies. About the same we can say about the test 19/20 kHz, we see not only the ultrasonic harmonics, but only those that can hear in the audio range.Yes sure, I don't know what exactly jfetter is using, but his graphs are limited at around 10KHz by some reason.
I am using a pro-grade Lynx L22 together with pro-grade German Dr Jordan Design's measurement solution.
100KHz analog bandwidth, 0.0001% external-loop distortion within 20Hz-20KHz bandwidth. High-enough precision instrument. See attached.
The only disadvantage is the price (around $1000 USD new in Moscow) 😉
yep u are in good direction. i use 2, 5, 10 khz
if hifi trim bias for best overall thd.
if music instrument then more specific band.
if hifi trim bias for best overall thd.
if music instrument then more specific band.
additional notes
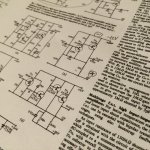
while working on power section i found two app notes in the file that influenced this preamp design.
: a single page i printed related to jfet ion impact current. (cant find ref)
basically not a problem on p channel. plus i wanted to use holes not electrons in first stage anyway because this amplifier is part of a physics thesis.
: July 1968 wireless world fig 5b on pg 200. the illustration has ps error but it is root idea.
cheers
Attachments

here are plots of to 25khz on the hybrid in progress.
http://www.diyaudio.com/forums/tubes-valves/291660-hybrid-output-5.html#post4732973
The hybrid output has a 12au7 as one of the CFP in above link.
http://www.diyaudio.com/forums/tubes-valves/291660-hybrid-output-5.html#post4732973
The hybrid output has a 12au7 as one of the CFP in above link.
- Status
- Not open for further replies.
- Home
- Amplifiers
- Solid State
- Simple discrete Sziklai pre