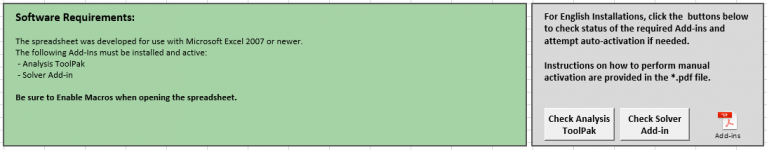
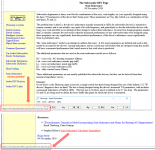
See top of the [Directions] TAB, Microsoft Excel 2007 or newer is required.
I should have included that information in Post#1.
Will add shortly...sorry about that.
I managed to get the V2 spreadsheet to work in excel 2010 but only after running the V1 spreadsheet. Before that I got an error that the reset solver macro could not be found. Very strange! this happened on two different computers.
Hmmm....maybe not as strange as it appeared...I have a theory.I managed to get the V2 spreadsheet to work in excel 2010 but only after running the V1 spreadsheet. Before that I got an error that the reset solver macro could not be found. Very strange! this happened on two different computers.
Note the software requirements include having the "Analysis Tool Pak" and "Solver" add-ins installed and active. Did you do this before running V2? If not, V1 of the spreadsheet checks to see if this is the case, and if not it attempts to activate them for you. Once active in your installation of Excel, they stay active unless you intentionally go and de-select them. V2 of the spreadsheet did not have this auto-activation feature. The reason I removed it was that it only worked if installation language was English. If it wasn't English it would give errors even when the required add-ins were installed and active. So, the spreadsheet was essentially unusable for non-English installations. I was unable to figure out a way around this problem, so removed it. I'm guessing that is what was going on.
V3 which I'm close to posting, will have some additional details on how to install and activate the required add-ins. It will also have a button to click for English installations that will do the activation for you. So, not fully auto-activation, but close for English installations, and will avoid problems with non-English installs. In addition to that, V3 will add FDD(Frequency Dependent Damping) parameters that Hornresp also includes a model for.
Awesome, yes this makes sense. I thought the add ins were enabled but the dialog boxes that I had showing this didn't look like yours which I presumed was due to a differing excel version but I may not have done it correctly. I am noticing changes in the response of boxes with the semi inductance model, thanks for the spreadsheet.
Steve, the data in this particular ZMA file (attached) seems to "break" the semi-inductance spreadsheet- it displays a #DIV/0 error when I try running the LS-fit routine. Any idea why?
The data in the ZMA file is impedance data extracted from the published impedance curve for the B&C 21DS115 driver.
The data in the ZMA file is impedance data extracted from the published impedance curve for the B&C 21DS115 driver.
Attachments
The issue is that there is not enough data below resonance for the curve fitting to converge on a good fit for Re’. I set Re’ = 5.6 (about half-way between DC resistance and minimum impedance above resonance) and then UNchecked the “Include Term” for Re’ so the LS-fit routine wouldn’t change it and achieved a decent fit.
I found another measurement posted online that had a bit more data below resonance and achieved similar results.
Test Bench: B&C Speakers 21DS115 21-Inch Woofer | audioXpress
Thanks for posting!
I will add a check for this issue and have a pop-up window provide suggestion how to work around the problem.
I also noticed that the 1kHz(Le) didn’t populate since the measured data did not include phase. I will add a check for this and use the curve-fit data for populating if measured phase is unavailable.
Attachments

I don't know why so many transducer mfg's still think 20Hz is the end of the content or the graph.
BTW I've added all of the semi LE specs to the drivers at DB. Not the legacy site the new one.
Awesome!
+1
I have added a link to the new DB driver page in the first post of this thread.
@ Josh Ricci,
Thanks so much for your hard work getting all that data incorporated.
I have added a link to the new DB driver page in the first post of this thread.
@ Josh Ricci,
Thanks so much for your hard work getting all that data incorporated.
+1
I have added a link to the new DB driver page in the first post of this thread.
@ Josh Ricci,
Thanks so much for your hard work getting all that data incorporated.
Thanks back at you!
The semi inductance specs are located on the individual driver pages. You know, there are 55 drivers on there and it really doesn't look like much when listed out. 🙁
Just a drop in the bass driver ocean...
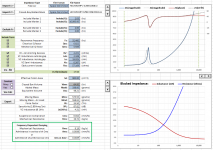
Semi-Le_Calc_V3
Version 3
Updates:
- Adds capability to calculate and export FDD model parameters if using added-mass method
- If measured data does not extend at least 2 octaves below Fs, pop-up window provides recommendation for achieving good convergence with the model
- Directions added for installing required Add-ins along with checking and auto-activation features for English installations of Excel
Fixes:
- ASCII file import improved to handle leading spaces
- Fix for VAS Calc issues with some versions of Excel
- Le(1kHz) calc now uses model data, if measured data does not contain phase
===========================================================
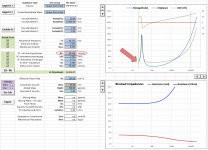
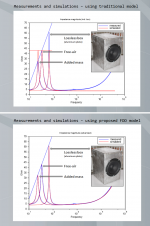
The FDD(Frequency Dependent Damping) models the mechanical damping behavior of the driver(Qms) and how it varies with frequency. Because electrical damping(Qes) provides the majority of damping in modern drivers, including FDD does not significantly change the predicted SPL response. However, the magnitude of the impedance peak(or peaks in higher order enclosures) will significantly change and match better with experimental results. For example, I attached comparisons from an AES presentation on FDD showing 3 impedance curves(free-air, added mass, and extremely rigid aluminum enclosure).
Note that the impedance peak magnitudes for free-air and added mass measurements determine the FDD parameters. If the woofer is not firmly restrained during both measurements, the peak magnitudes will not be properly captured, and will affect the accuracy of the parameters.
Possible convergence issues due to a limited data set are now brought to the attention of the user.
See Post#25 for more details.
Buttons for auto-activating the required Add-ins for English installations were added to the top of the “Directions” TAB along with a *.pdf file with details on manual activation.
Version 3
Updates:
- Adds capability to calculate and export FDD model parameters if using added-mass method
- If measured data does not extend at least 2 octaves below Fs, pop-up window provides recommendation for achieving good convergence with the model
- Directions added for installing required Add-ins along with checking and auto-activation features for English installations of Excel
Fixes:
- ASCII file import improved to handle leading spaces
- Fix for VAS Calc issues with some versions of Excel
- Le(1kHz) calc now uses model data, if measured data does not contain phase
===========================================================
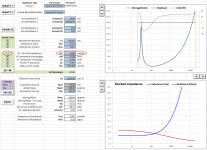
The FDD(Frequency Dependent Damping) models the mechanical damping behavior of the driver(Qms) and how it varies with frequency. Because electrical damping(Qes) provides the majority of damping in modern drivers, including FDD does not significantly change the predicted SPL response. However, the magnitude of the impedance peak(or peaks in higher order enclosures) will significantly change and match better with experimental results. For example, I attached comparisons from an AES presentation on FDD showing 3 impedance curves(free-air, added mass, and extremely rigid aluminum enclosure).
Note that the impedance peak magnitudes for free-air and added mass measurements determine the FDD parameters. If the woofer is not firmly restrained during both measurements, the peak magnitudes will not be properly captured, and will affect the accuracy of the parameters.
Possible convergence issues due to a limited data set are now brought to the attention of the user.
See Post#25 for more details.
Buttons for auto-activating the required Add-ins for English installations were added to the top of the “Directions” TAB along with a *.pdf file with details on manual activation.
Attachments
Will be looking carefully at this latest version Stephen.
Thanks for making the spreadsheet. I'm guessing that there are quite a few hours involved in this.
Thanks for making the spreadsheet. I'm guessing that there are quite a few hours involved in this.
cool I had been wondering why my impedance peaks where not matching the models, thanks for the update.
Version 3
Updates:
Excellent...I'll update the download at DB forum to the newest version.
Thanks for your continued work.

cool I had been wondering why my impedance peaks where not matching the models, thanks for the update.
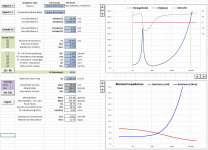
The FDD model does certainly help, especially with the lower impedance peak on vented enclosures which is pretty much always measures lower in magnitude than traditional modeling predicts. But, it is only one piece of the puzzle. The other piece of the puzzle is the damping coming from enclosures that are not ideally stiff. For example, generally when putting a woofer in a well braced wooden box the magnitude of the impedance peak goes down slightly because of the damping from the flexibility of the walls. In the AES example I posted with near lossless aluminum enclosure, the impedance peak is seen to increase in magnitude. Until we figure out how to account for damping from the enclosure(ie not from damping material in the enclosure) the impedance peaks will still not quite match at higher frequencies.
BTW, the first time I saw a measured impedance peak increase in magnitude was in a YG Acoustics brochure. At the time, I did not understand how that was possible.
Attachments
BTW, the first time I saw a measured impedance peak increase in magnitude was in a YG Acoustics brochure. At the time, I did not understand how that was possible.
That brochure is a great example of "marketing-speak"....
Yup. Not sure if you had looked thru their technology brochures before.
The measurements are real, but the verbiage...
Thanks again for including an alternate home for downloading the Semi-Le spreadsheet on your website. Not sure it it was intentional or not, but just noticed that the link at the bottom of the page points to V3, but the link at the top of the page still points to V2.
Attachments
Thanks! Can you point me to the location of the DB forum download?Excellent...I'll update the download at DB forum to the newest version.
That brochure is a great example of "marketing-speak"....
Immeasurably high Q ha. Considering I have an IEEE paper on measurement of quality factors exceeding 1000 I find that hilarious.
High - Coil Measurement for Inductive Power Transfer - IEEE Journals & Magazine
Thanks! Can you point me to the location of the DB forum download?
It's here
Bolserst's Complex Driver Inductance Calculator - Bass Gear - Data-Bass Forums
Stiffness and impedance peak is related to the elasticity of the enclosure.
Your measurements and the paper that you cite prove this.
The relationship is perhaps found in elasticity modulus differences between the enclosure materials. Bracing is a change of course. But this should be able to be modeled.
P.S.
Awesome work Stephen!
Your measurements and the paper that you cite prove this.
The relationship is perhaps found in elasticity modulus differences between the enclosure materials. Bracing is a change of course. But this should be able to be modeled.
P.S.
Awesome work Stephen!
- Home
- Loudspeakers
- Subwoofers
- Semi-Le_Calc: Calculator for Advanced Inductance Model Incorporating Semi-Inductance